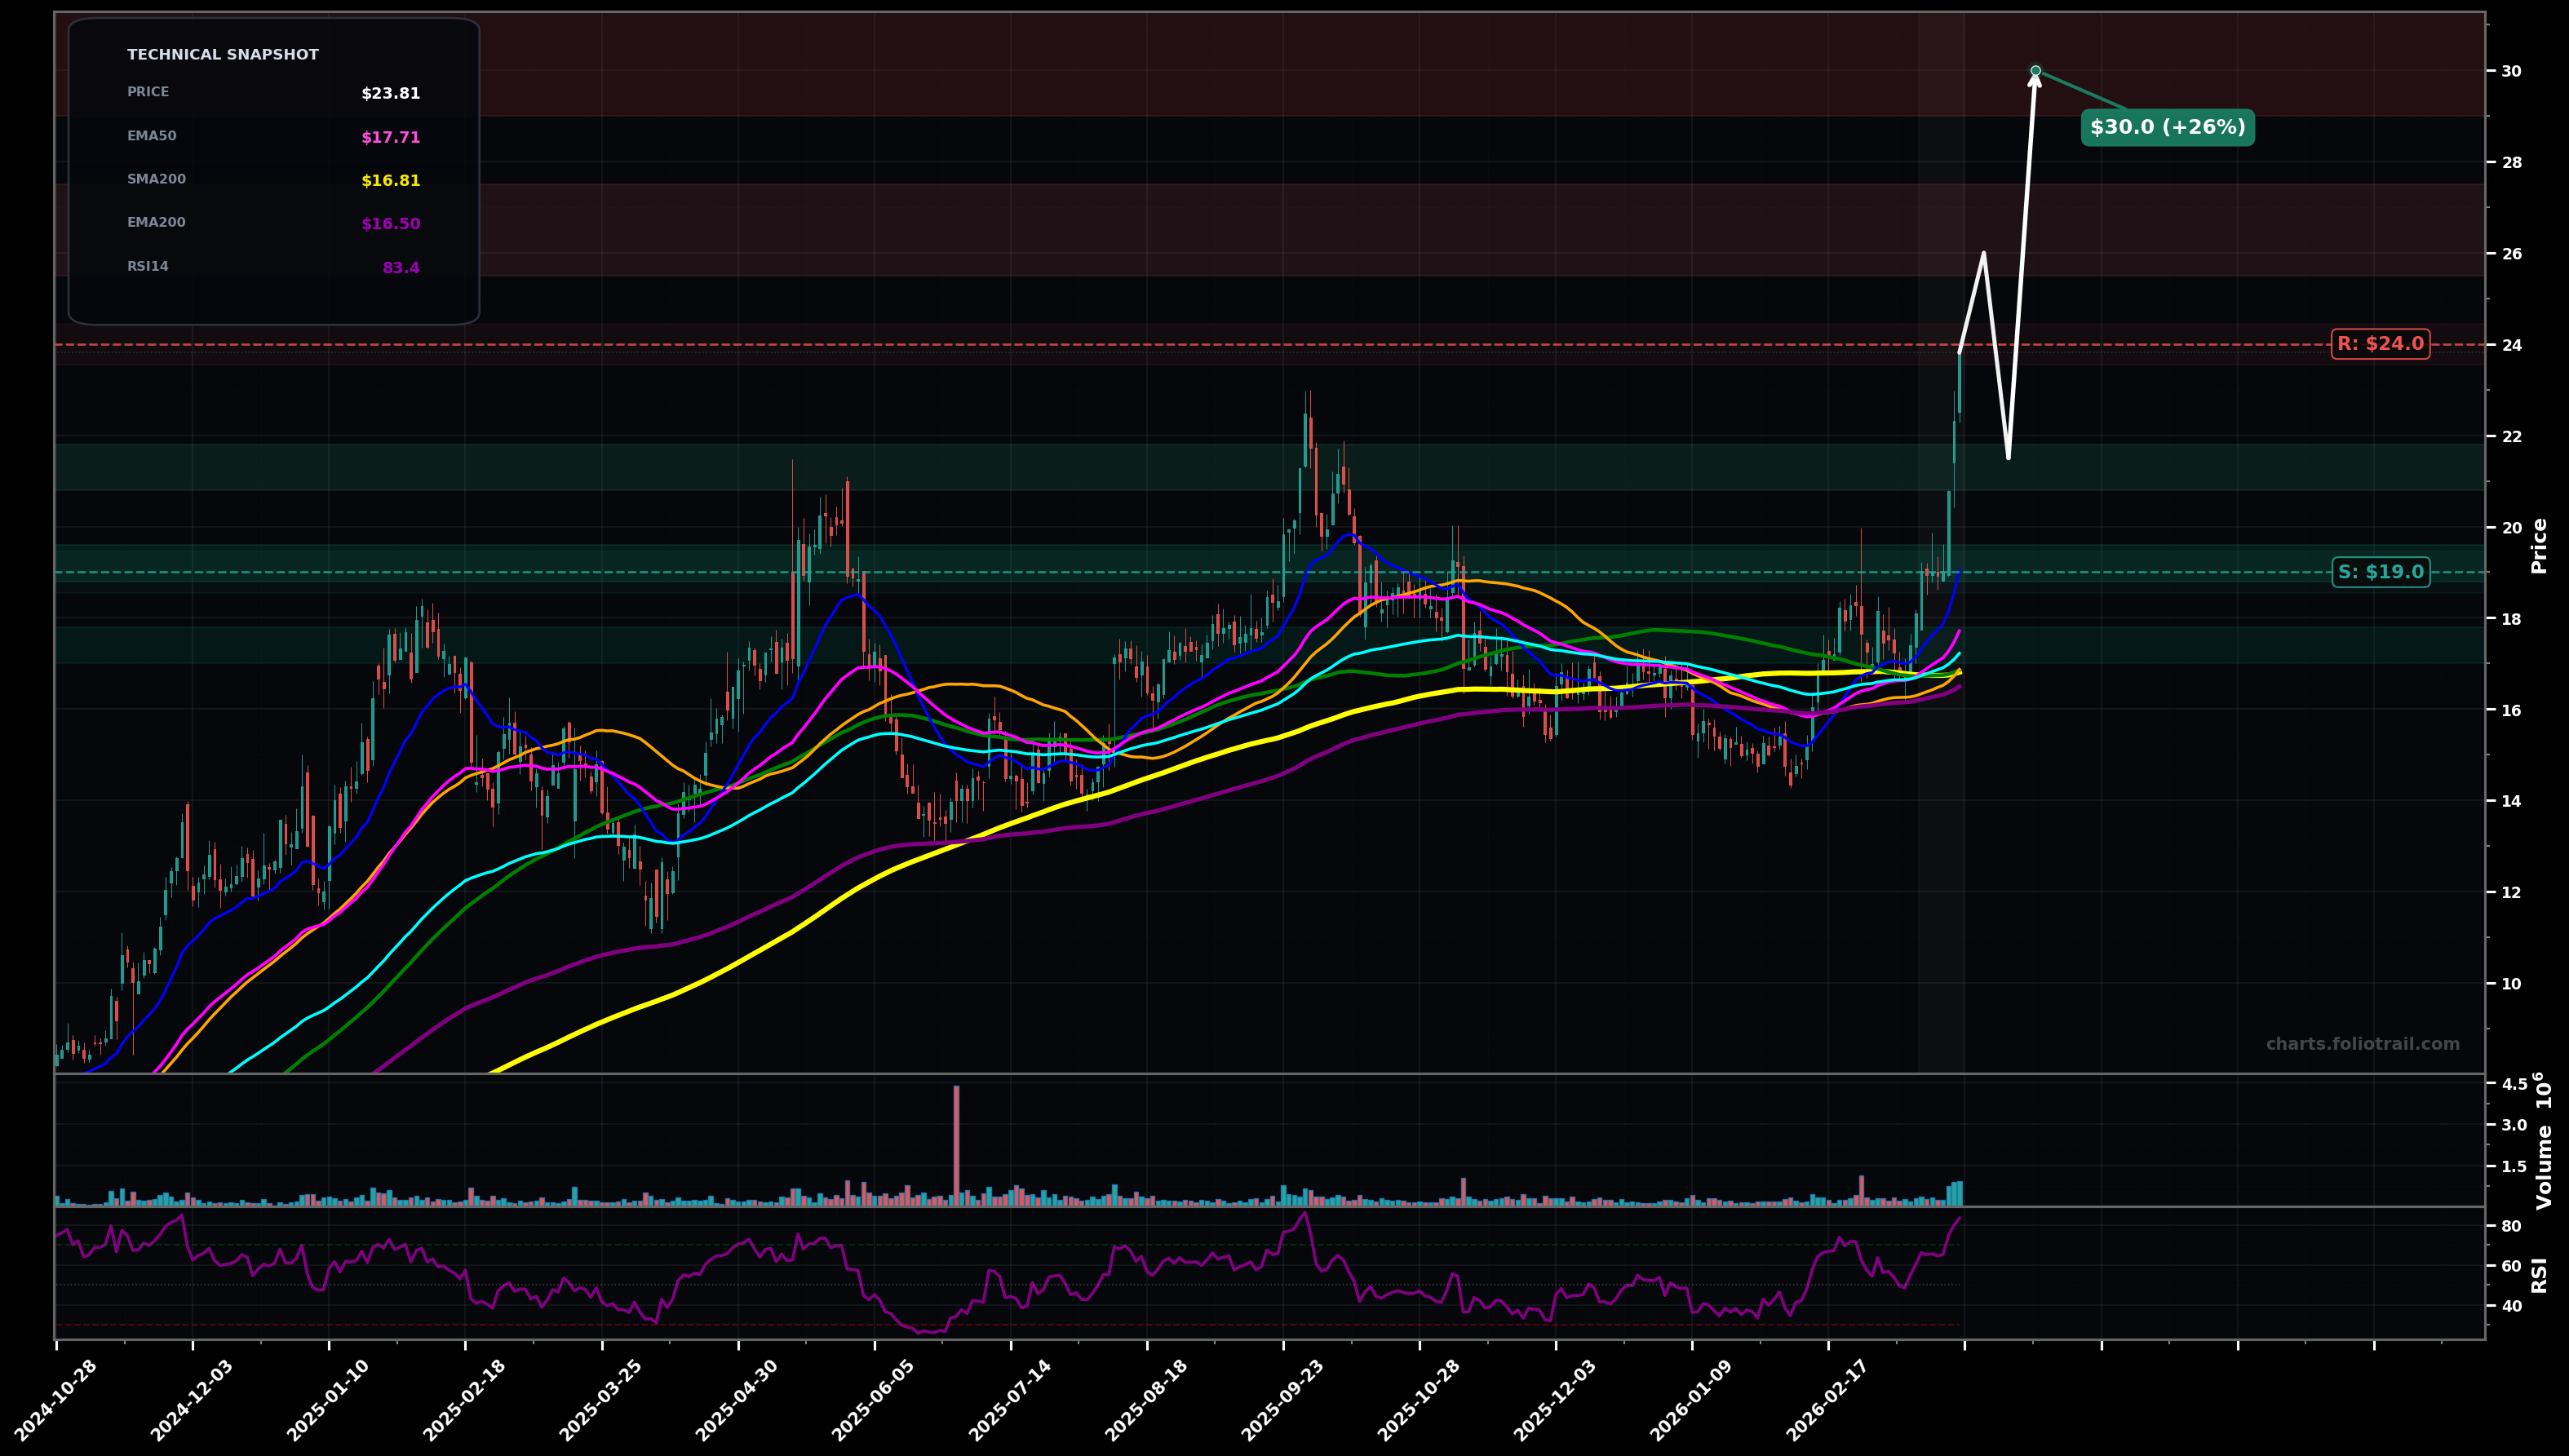
As of March 24, 2026, ETON (Eton Pharmaceuticals Inc.) is in a parabolic state on the daily chart, with a confidence level of 72%. Key support is at $19.0 and key resistance at $24.0. Sharp breakout from a multi-month base above clustered MAs; strong impulsive push to ~$24 with RSI stretched (~83).
Bullish continuation: brief pullback/flag above the breakout area, then another leg higher (Elliott: likely wave 3 extension or late wave 5 blow-off).
Mean-reversion after parabolic push: deeper retrace to the MA cluster/previous range (Elliott: wave 4 or start of a larger ABC), then attempt to rebuild.
Daily close above $24.00 followed by another close holding above $23.00
Daily close back below $19.00 (loss of breakout zone and prior highs/MA cluster)
Buy-the-dip tiers aligned to likely post-breakout retest ($21-22), then major pivot/round-number support (~$19), then EMA50/EMA100 cluster and prior base top (~$17-18).
Parabolic extensions typically revert; trim into successive upside extensions (probable Fib extensions from the $15-$19 base and prior swing) where RSI/price distance from EMA50 becomes extreme.
As of March 24, 2026, ETON (Eton Pharmaceuticals Inc.) is in a parabolic state on the daily chart with 72% confidence. Sharp breakout from a multi-month base above clustered MAs; strong impulsive push to ~$24 with RSI stretched (~83).
On the daily timeframe, ETON has key support at $19.0 and key resistance at $24.0. The most likely scenario (bullish) targets $26.0 and $30.0, with a revert level at $21.5.
ETON (Eton Pharmaceuticals Inc.) is currently classified as parabolic on the daily chart, with 72% confidence. Confirmation requires: Daily close above $24.00 followed by another close holding above $23.00 This would be invalidated by: Daily close back below $19.00 (loss of breakout zone and prior highs/MA cluster)
The most likely scenario (bullish) targets $26.0 and $30.0, with a revert level at $21.5. The alternative scenario (bearish) targets $19.0 and $17.7.
All content on this website — including charts, analysis, price targets, support/resistance levels, and position zones — is generated entirely by AI and provided for educational and informational purposes only.
This is not financial advice. NEXUSNOIR VENTURES SL (the operator of this website) is not a registered investment adviser or broker-dealer. You should not make investment decisions based solely on this information. Always do your own research and consult a qualified financial advisor.
By continuing, you acknowledge that you have read and agree to our full disclaimer & terms of use and privacy policy.