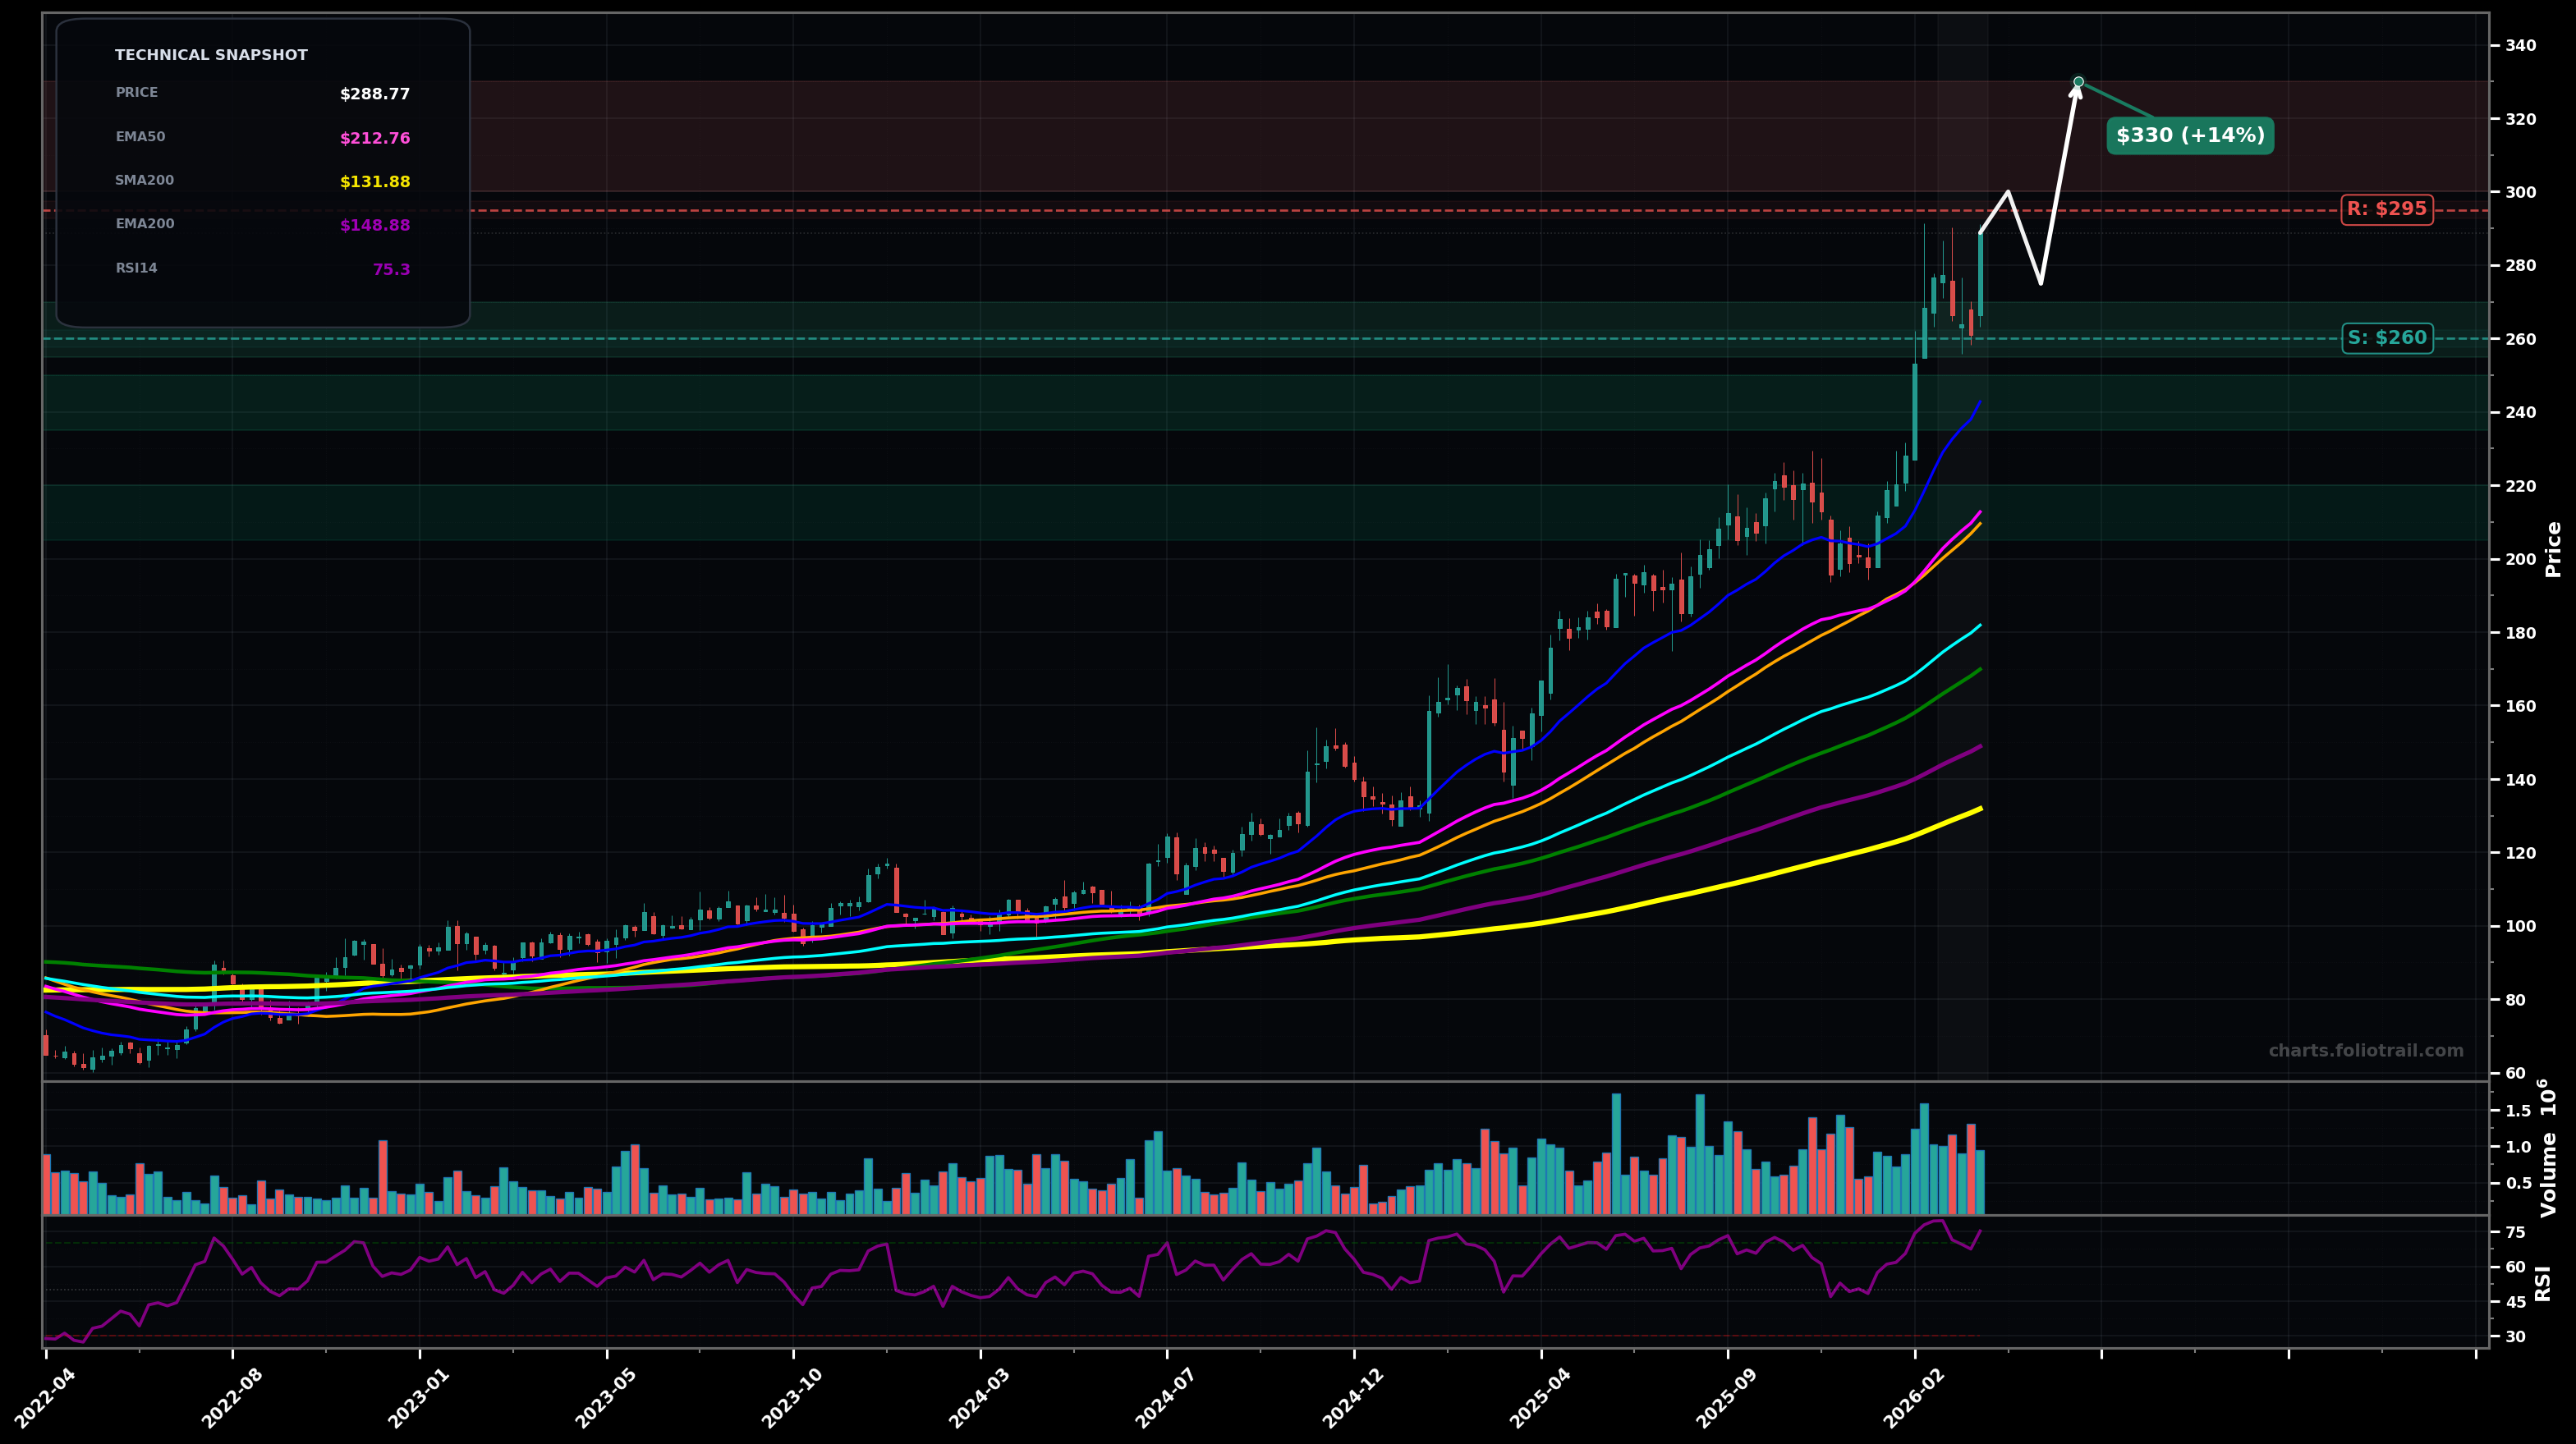
As of March 26, 2026, ESE (Esco Technologies Inc.) is in a uptrend state on the weekly chart, with a confidence level of 78%. Key support is at $260 and key resistance at $295. Strong HH/HL advance with a sharp breakout leg to new highs; price ($288.77) is extended above rising EMA50 ($212.76) / EMA100 ($181.90); RSI-14 (~75) shows overbought momentum.
Bullish continuation: price consolidates above the breakout zone ($260–$280) then resumes trend to a measured-move extension.
Bearish pullback within uptrend: overbought condition mean-reverts toward the rising EMA50 area before trend attempts to rebase.
Weekly close above $295 (new breakout continuation) with follow-through holding above $280.
Weekly close below $260 (breaks the most recent breakout pivot zone and shifts to deeper pullback risk).
Start/add focus on reclaim/hold of breakout support ($260 area) and deeper dip buy zones into prior pivot + rising EMA50 (~$213) where trend support is strongest.
Trim into extension legs (Elliott Wave late Wave-3/5 feel) as distance to EMA50 expands and RSI stays elevated; heavier trims on blow-off extensions vs the moving-average stack.
As of March 26, 2026, ESE (Esco Technologies Inc.) is in a uptrend state on the weekly chart with 78% confidence. Strong HH/HL advance with a sharp breakout leg to new highs; price ($288.77) is extended above rising EMA50 ($212.76) / EMA100 ($181.90); RSI-14 (~75) shows overbought momentum.
On the weekly timeframe, ESE has key support at $260 and key resistance at $295. The most likely scenario (bullish) targets $300 and $330, with a revert level at $275.
ESE (Esco Technologies Inc.) is currently classified as uptrend on the weekly chart, with 78% confidence. Confirmation requires: Weekly close above $295 (new breakout continuation) with follow-through holding above $280. This would be invalidated by: Weekly close below $260 (breaks the most recent breakout pivot zone and shifts to deeper pullback risk).
The most likely scenario (bullish) targets $300 and $330, with a revert level at $275. The alternative scenario (bearish) targets $245 and $213.
Multi-layer AI agents analyse 200+ stocks across daily, weekly, and monthly timeframes — producing market state classifications, price scenarios with targets, and position entry/exit levels. Updated every trading day after market close. No paywall. No sign-up required.
Built by Foliotrail.
All content on this website — including charts, analysis, price targets, support/resistance levels, and position zones — is generated entirely by AI and provided for educational and informational purposes only.
This is not financial advice. NEXUSNOIR VENTURES SL (the operator of this website) is not a registered investment adviser or broker-dealer. You should not make investment decisions based solely on this information. Always do your own research and consult a qualified financial advisor.
By continuing, you acknowledge that you have read and agree to our full disclaimer & terms of use and privacy policy.