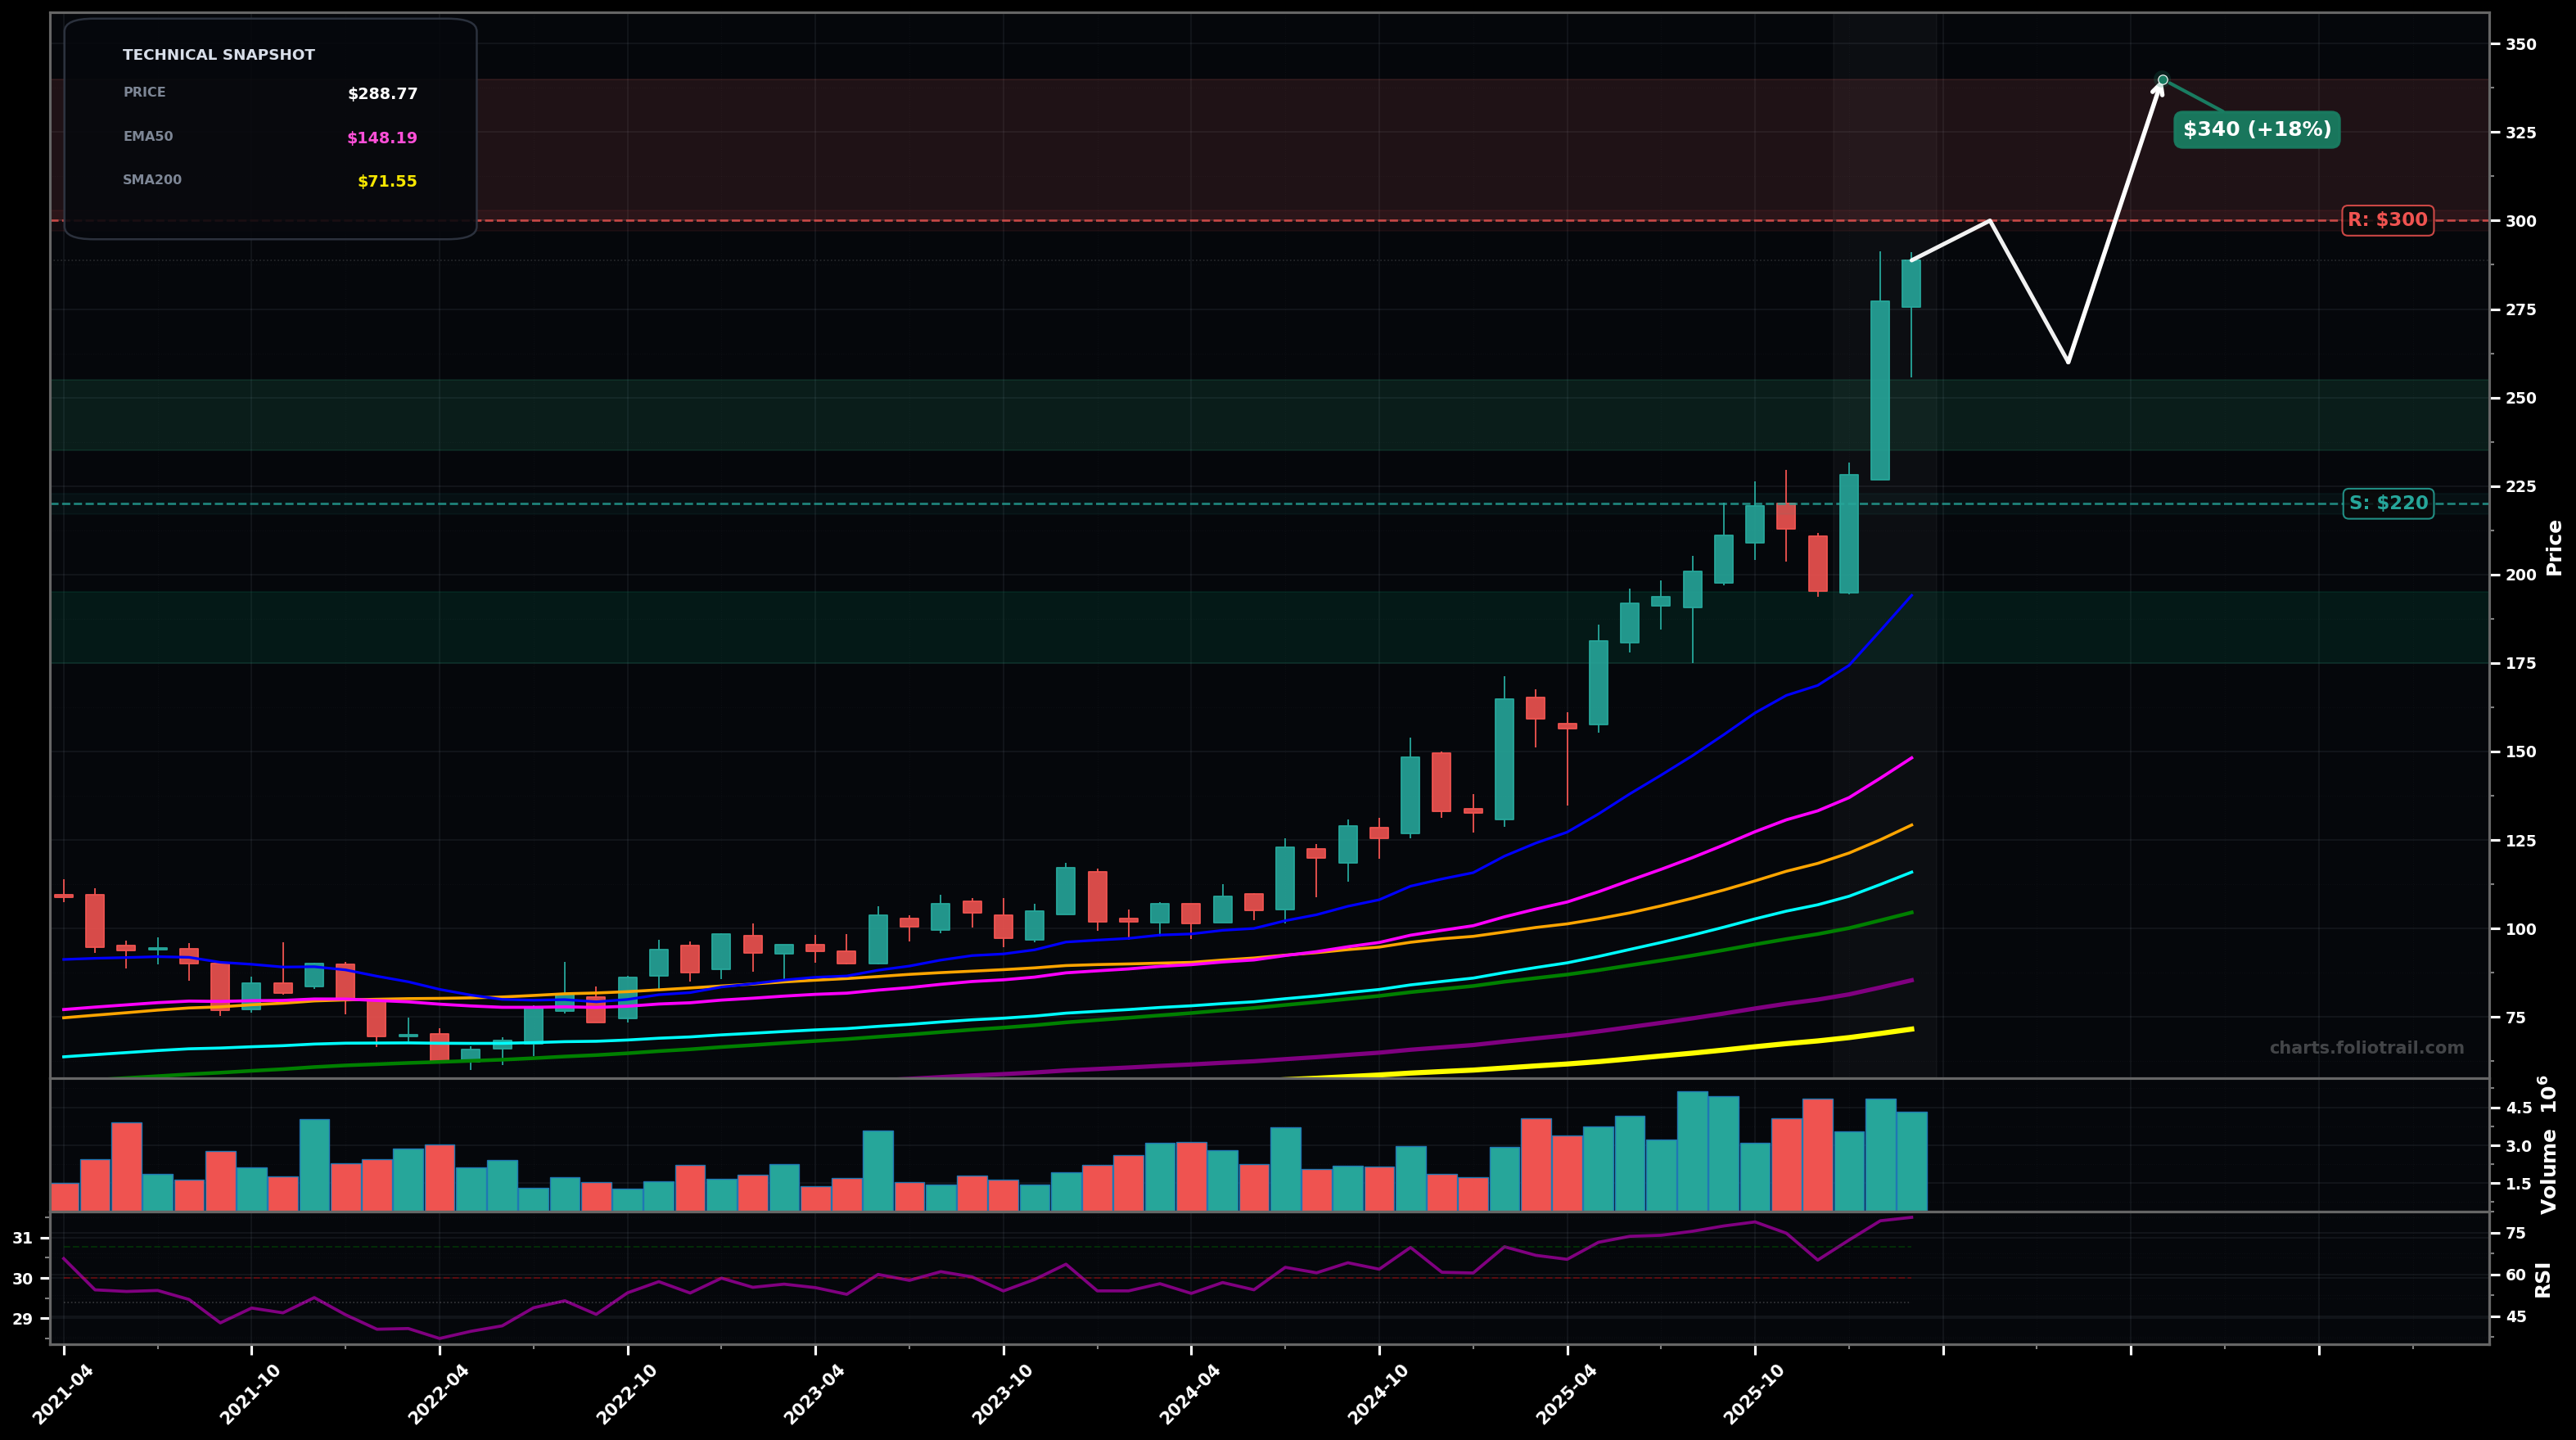
As of March 26, 2026, ESE (Esco Technologies Inc.) is in a parabolic state on the monthly chart, with a confidence level of 74%. Key support is at $220 and key resistance at $300. Strong monthly breakout to new highs; price extended far above rising EMA50/EMA100 with RSI very overbought.
Continuation higher (likely Elliott Wave 5 extension) with a brief consolidation/pullback, then another push to new highs; Fibonacci-style extension target zone above the prior impulse projects into the low-$300s.
Mean-reversion correction (parabolic unwind): a deeper pullback toward the rising EMA50/structure, then stabilization and attempt to resume trend; typical if monthly momentum cools from RSI>80.
2+ monthly closes holding above ~$270 would confirm continued parabolic continuation
Monthly close back below ~$220 would invalidate the parabolic continuation and suggest a larger correction
Buy zones align with likely pullback shelves: prior breakout/round-number support (~$240–$260), then stronger demand near ~$220, with heavy adds only if a deeper retrace tags the high-probability trend-reset area (~$180–$195) closer to rising EMA20/structure.
Trim into extension levels as price is extremely stretched vs EMA50/EMA100 (parabolic risk); heavier trims on further extensions, and fully close only if a multi-year overshoot develops well above projected fib extensions.
As of March 26, 2026, ESE (Esco Technologies Inc.) is in a parabolic state on the monthly chart with 74% confidence. Strong monthly breakout to new highs; price extended far above rising EMA50/EMA100 with RSI very overbought.
On the monthly timeframe, ESE has key support at $220 and key resistance at $300. The most likely scenario (bullish) targets $300 and $340, with a revert level at $260.
ESE (Esco Technologies Inc.) is currently classified as parabolic on the monthly chart, with 74% confidence. Confirmation requires: 2+ monthly closes holding above ~$270 would confirm continued parabolic continuation This would be invalidated by: Monthly close back below ~$220 would invalidate the parabolic continuation and suggest a larger correction
The most likely scenario (bullish) targets $300 and $340, with a revert level at $260. The alternative scenario (bearish) targets $240 and $190.
Multi-layer AI agents analyse 200+ stocks across daily, weekly, and monthly timeframes — producing market state classifications, price scenarios with targets, and position entry/exit levels. Updated every trading day after market close. No paywall. No sign-up required.
Built by Foliotrail.
All content on this website — including charts, analysis, price targets, support/resistance levels, and position zones — is generated entirely by AI and provided for educational and informational purposes only.
This is not financial advice. NEXUSNOIR VENTURES SL (the operator of this website) is not a registered investment adviser or broker-dealer. You should not make investment decisions based solely on this information. Always do your own research and consult a qualified financial advisor.
By continuing, you acknowledge that you have read and agree to our full disclaimer & terms of use and privacy policy.