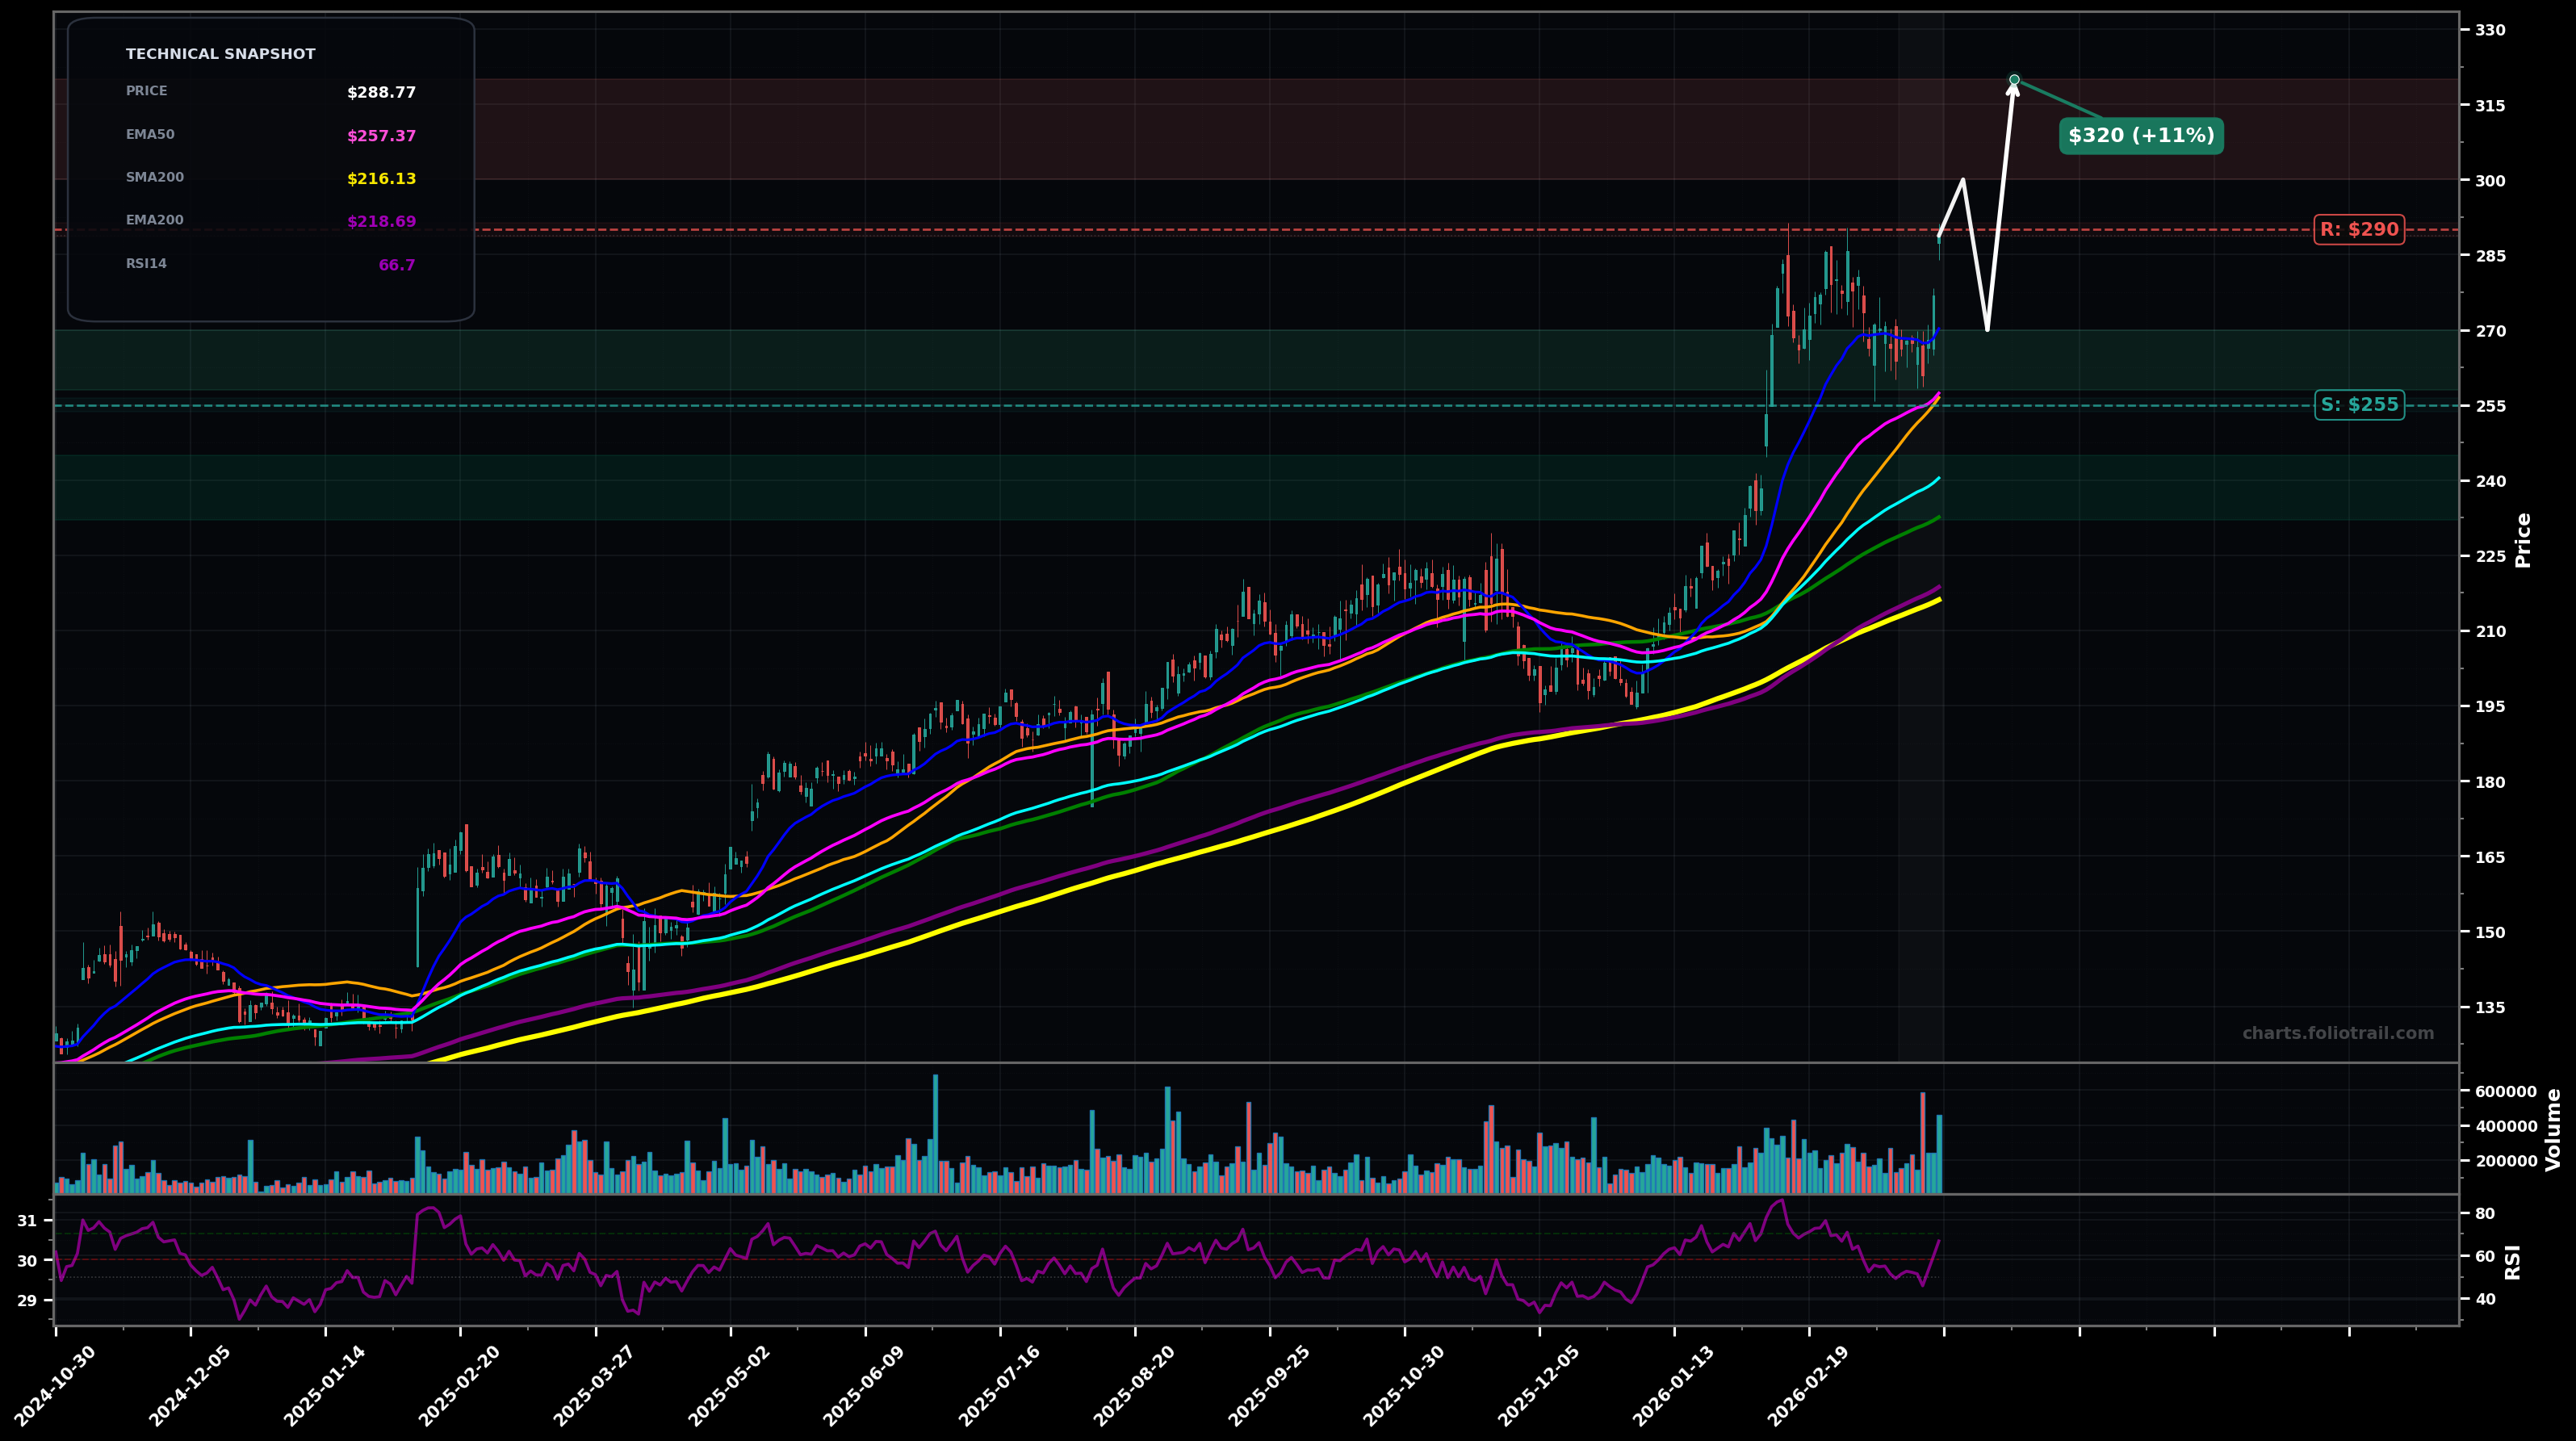
As of March 26, 2026, ESE (Esco Technologies Inc.) is in a uptrend state on the daily chart, with a confidence level of 74%. Key support is at $255 and key resistance at $290. Strong HH/HL structure with price holding above rising EMA50/EMA100; recent consolidation near highs followed by continuation push back toward the prior peak.
Bullish continuation: pullback holds the $255-$270 moving-average confluence, then price breaks $290 and trends to the next extension zone; Elliott view: late wave 3 / early wave 5 continuation after a shallow wave 4-style flag.
Deeper consolidation/mean reversion: rejection at $290 leads to a larger ABC pullback into the prior breakout shelf and EMA100 area; still constructive if it forms a higher low and reclaims $270-$275.
Daily close above $290 with follow-through (2+ closes holding above $290).
Daily close below $255 (loss of EMA50/SMA50 zone).
Buy-the-dip zones mapped to EMA50/SMA50 confluence (~$257-$256), then EMA100/SMA100 support (~$240-$233) and the prior breakout structure for a higher-low attempt.
Trim into upside extensions after a strong impulsive leg (RSI elevated, price stretched above EMA50/EMA100); progressively heavier trimming at likely fib-extension/psychological zones.
As of March 26, 2026, ESE (Esco Technologies Inc.) is in a uptrend state on the daily chart with 74% confidence. Strong HH/HL structure with price holding above rising EMA50/EMA100; recent consolidation near highs followed by continuation push back toward the prior peak.
On the daily timeframe, ESE has key support at $255 and key resistance at $290. The most likely scenario (bullish) targets $300 and $320, with a revert level at $270.
ESE (Esco Technologies Inc.) is currently classified as uptrend on the daily chart, with 74% confidence. Confirmation requires: Daily close above $290 with follow-through (2+ closes holding above $290). This would be invalidated by: Daily close below $255 (loss of EMA50/SMA50 zone).
The most likely scenario (bullish) targets $300 and $320, with a revert level at $270. The alternative scenario (bearish) targets $245 and $232.
Multi-layer AI agents analyse 200+ stocks across daily, weekly, and monthly timeframes — producing market state classifications, price scenarios with targets, and position entry/exit levels. Updated every trading day after market close. No paywall. No sign-up required.
Built by Foliotrail.
All content on this website — including charts, analysis, price targets, support/resistance levels, and position zones — is generated entirely by AI and provided for educational and informational purposes only.
This is not financial advice. NEXUSNOIR VENTURES SL (the operator of this website) is not a registered investment adviser or broker-dealer. You should not make investment decisions based solely on this information. Always do your own research and consult a qualified financial advisor.
By continuing, you acknowledge that you have read and agree to our full disclaimer & terms of use and privacy policy.