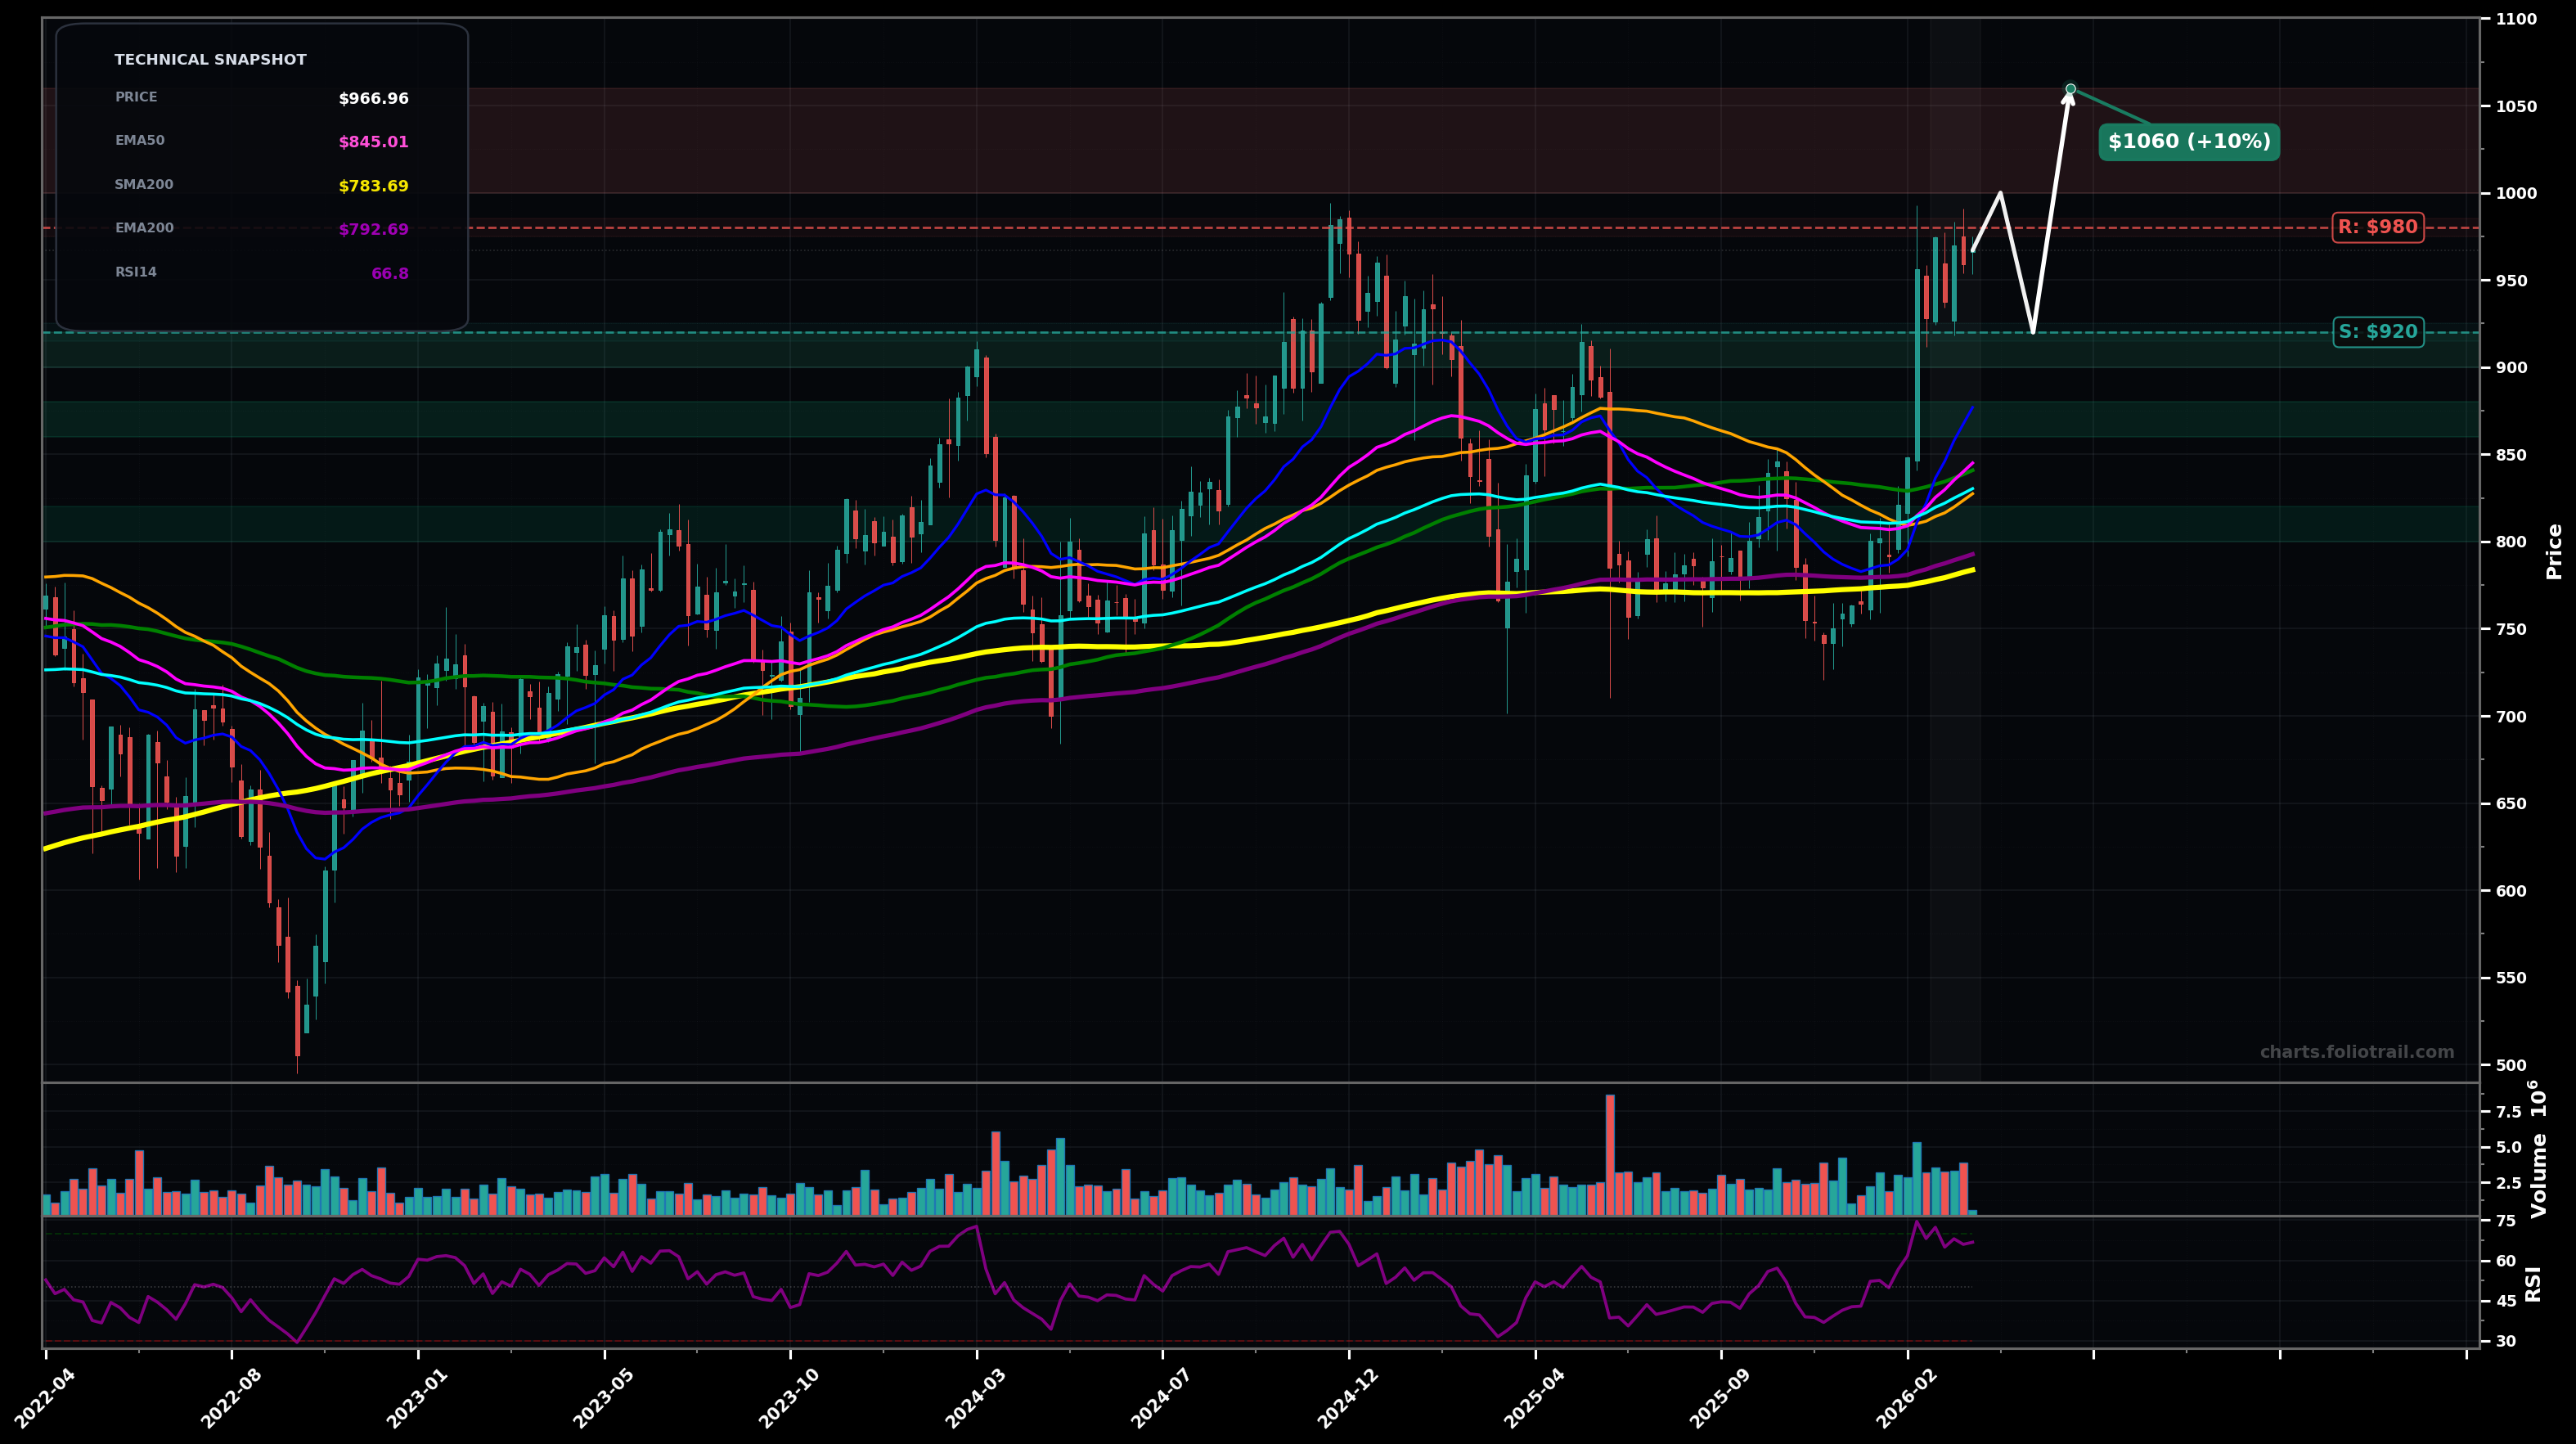
As of March 24, 2026, EQIX (Equinix, Inc.) is in a uptrend state on the weekly chart, with a confidence level of 72%. Key support is at $920 and key resistance at $980. Strong breakout from the $760–$820 base; price is holding above rising EMA50/EMA100 with RSI(14) ~67 and a tight consolidation near $960s after the impulse leg.
Bullish continuation: consolidation resolves higher (wave (3)/(5)-type extension), with a shallow pullback/retest that holds above the breakout zone before pushing to measured/Fib extensions.
Bearish mean-reversion: failed continuation from $980 leads to a deeper pullback toward the rising MA cluster; still constructive if it forms a higher low (wave (4) corrective).
Weekly close above $980 with follow-through (2+ weekly closes holding above $960).
Weekly close below $876 (EMA20 area) would signal breakout failure risk and shift toward range/mean reversion.
Buy-the-dip framework: $900–$920 is first HL/retest area; $860–$880 aligns with EMA20/structure; $800–$820 is prior range top + major breakout pivot (best risk/reward if revisited).
Trim into extension: $1,000–$1,060 is psychological + likely Fib extension zone; $1,060–$1,150 is higher-extension/overbought risk; $1,150–$1,250 would be multi-year stretch relative to MA stack and prior cycle highs.
As of March 24, 2026, EQIX (Equinix, Inc.) is in a uptrend state on the weekly chart with 72% confidence. Strong breakout from the $760–$820 base; price is holding above rising EMA50/EMA100 with RSI(14) ~67 and a tight consolidation near $960s after the impulse leg.
On the weekly timeframe, EQIX has key support at $920 and key resistance at $980. The most likely scenario (bullish) targets $1000 and $1060, with a revert level at $920.
EQIX (Equinix, Inc.) is currently classified as uptrend on the weekly chart, with 72% confidence. Confirmation requires: Weekly close above $980 with follow-through (2+ weekly closes holding above $960). This would be invalidated by: Weekly close below $876 (EMA20 area) would signal breakout failure risk and shift toward range/mean reversion.
The most likely scenario (bullish) targets $1000 and $1060, with a revert level at $920. The alternative scenario (bearish) targets $876 and $845.
All content on this website — including charts, analysis, price targets, support/resistance levels, and position zones — is generated entirely by AI and provided for educational and informational purposes only.
This is not financial advice. NEXUSNOIR VENTURES SL (the operator of this website) is not a registered investment adviser or broker-dealer. You should not make investment decisions based solely on this information. Always do your own research and consult a qualified financial advisor.
By continuing, you acknowledge that you have read and agree to our full disclaimer & terms of use and privacy policy.