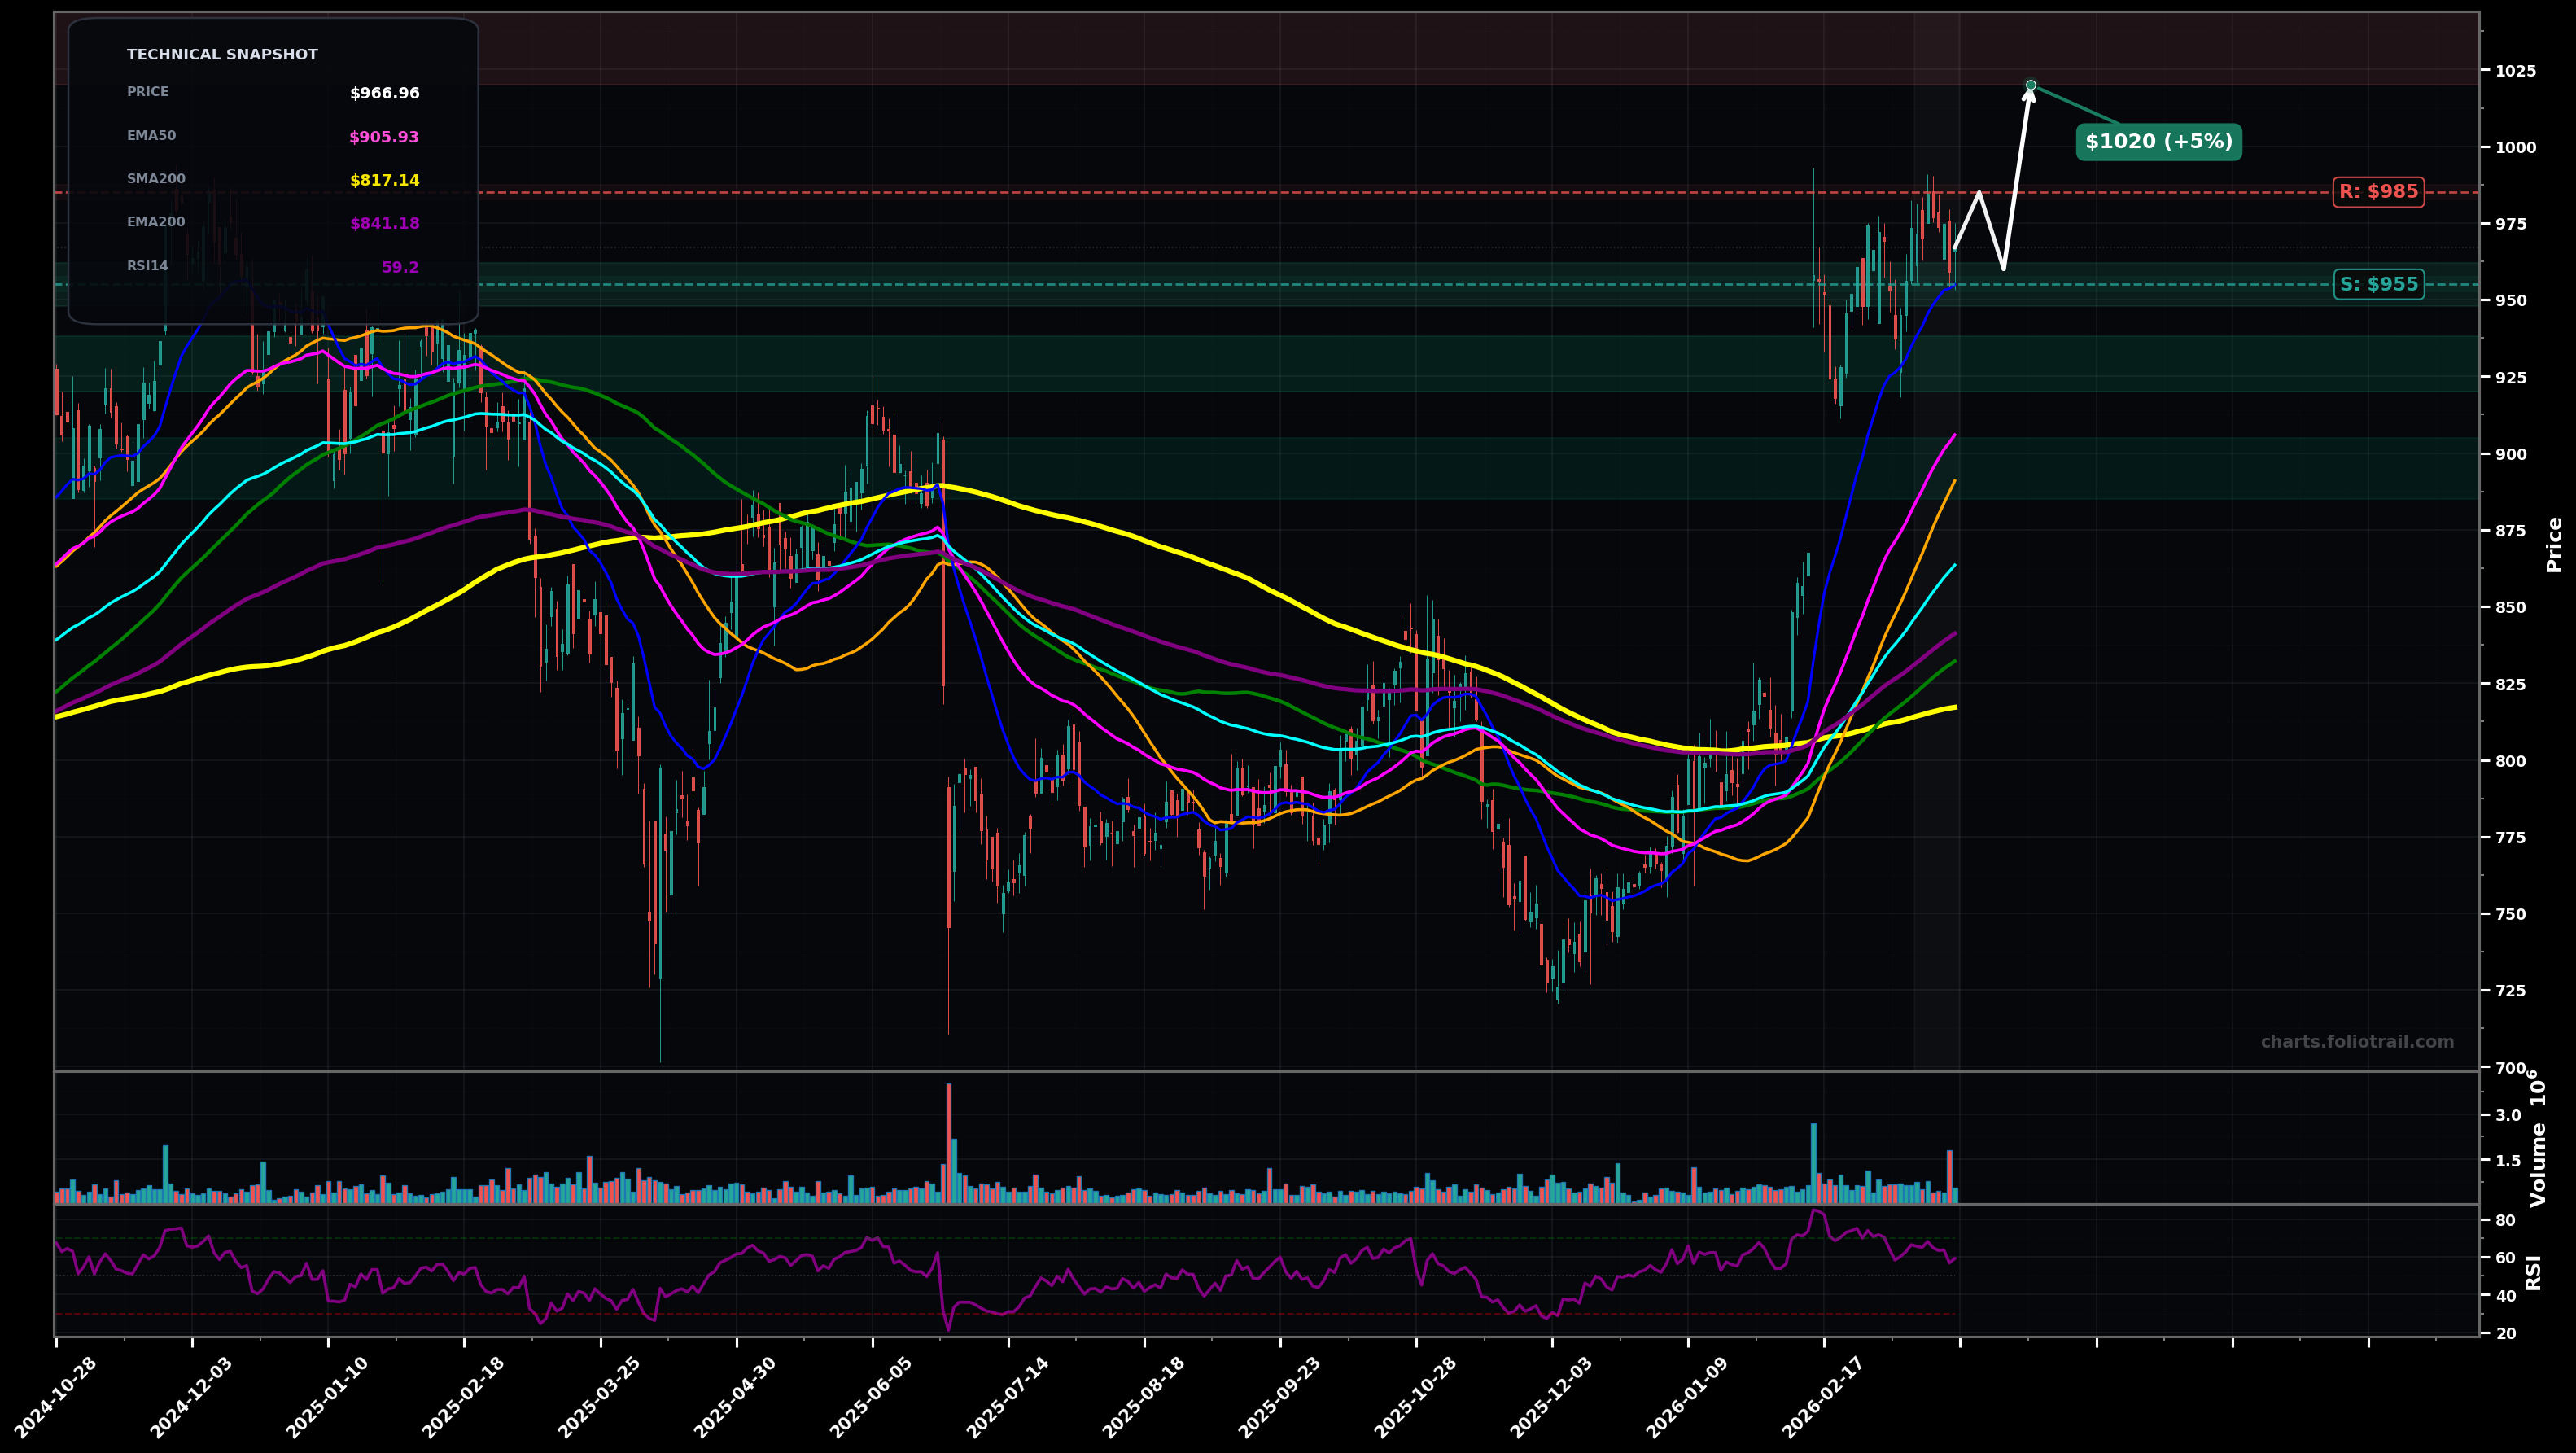
As of March 24, 2026, EQIX (Equinix, Inc.) is in a uptrend state on the daily chart, with a confidence level of 74%. Key support is at $955 and key resistance at $985. Strong breakout leg from the $780-$820 base, now consolidating near $970 after printing a new swing high around the high-$980s; pullback holding above rising short MAs.
Bullish continuation: shallow pullback/retest into the $955-$965 area (EMA20/EMA50 zone) then push to take out the recent swing high; fits an Elliott Wave impulse where the current pause is a Wave 4 consolidation before a Wave 5 attempt higher.
Bearish pullback: failure to reclaim/hold $985 leads to a deeper mean-reversion move toward the breakout shelf and rising medium MAs; still could remain a broader bullish structure if it holds a higher low (Wave 4 deeper alternative).
2+ daily closes above $985
Daily close below $945
Start near EMA50/EMA20 support (~$955-$965), add on deeper pullback toward prior breakout/MA confluence (~$920-$938), heavy add at the major breakout pivot/supply-flip zone (~$885-$905).
Trim into likely Wave-5/extension areas above the recent swing high where price may get stretched vs EMA50/EMA100; scale more aggressively if momentum looks climactic and distance to EMA50 expands.
As of March 24, 2026, EQIX (Equinix, Inc.) is in a uptrend state on the daily chart with 74% confidence. Strong breakout leg from the $780-$820 base, now consolidating near $970 after printing a new swing high around the high-$980s; pullback holding above rising short MAs.
On the daily timeframe, EQIX has key support at $955 and key resistance at $985. The most likely scenario (bullish) targets $985 and $1020, with a revert level at $960.
EQIX (Equinix, Inc.) is currently classified as uptrend on the daily chart, with 74% confidence. Confirmation requires: 2+ daily closes above $985 This would be invalidated by: Daily close below $945
The most likely scenario (bullish) targets $985 and $1020, with a revert level at $960. The alternative scenario (bearish) targets $940 and $900.
All content on this website — including charts, analysis, price targets, support/resistance levels, and position zones — is generated entirely by AI and provided for educational and informational purposes only.
This is not financial advice. NEXUSNOIR VENTURES SL (the operator of this website) is not a registered investment adviser or broker-dealer. You should not make investment decisions based solely on this information. Always do your own research and consult a qualified financial advisor.
By continuing, you acknowledge that you have read and agree to our full disclaimer & terms of use and privacy policy.