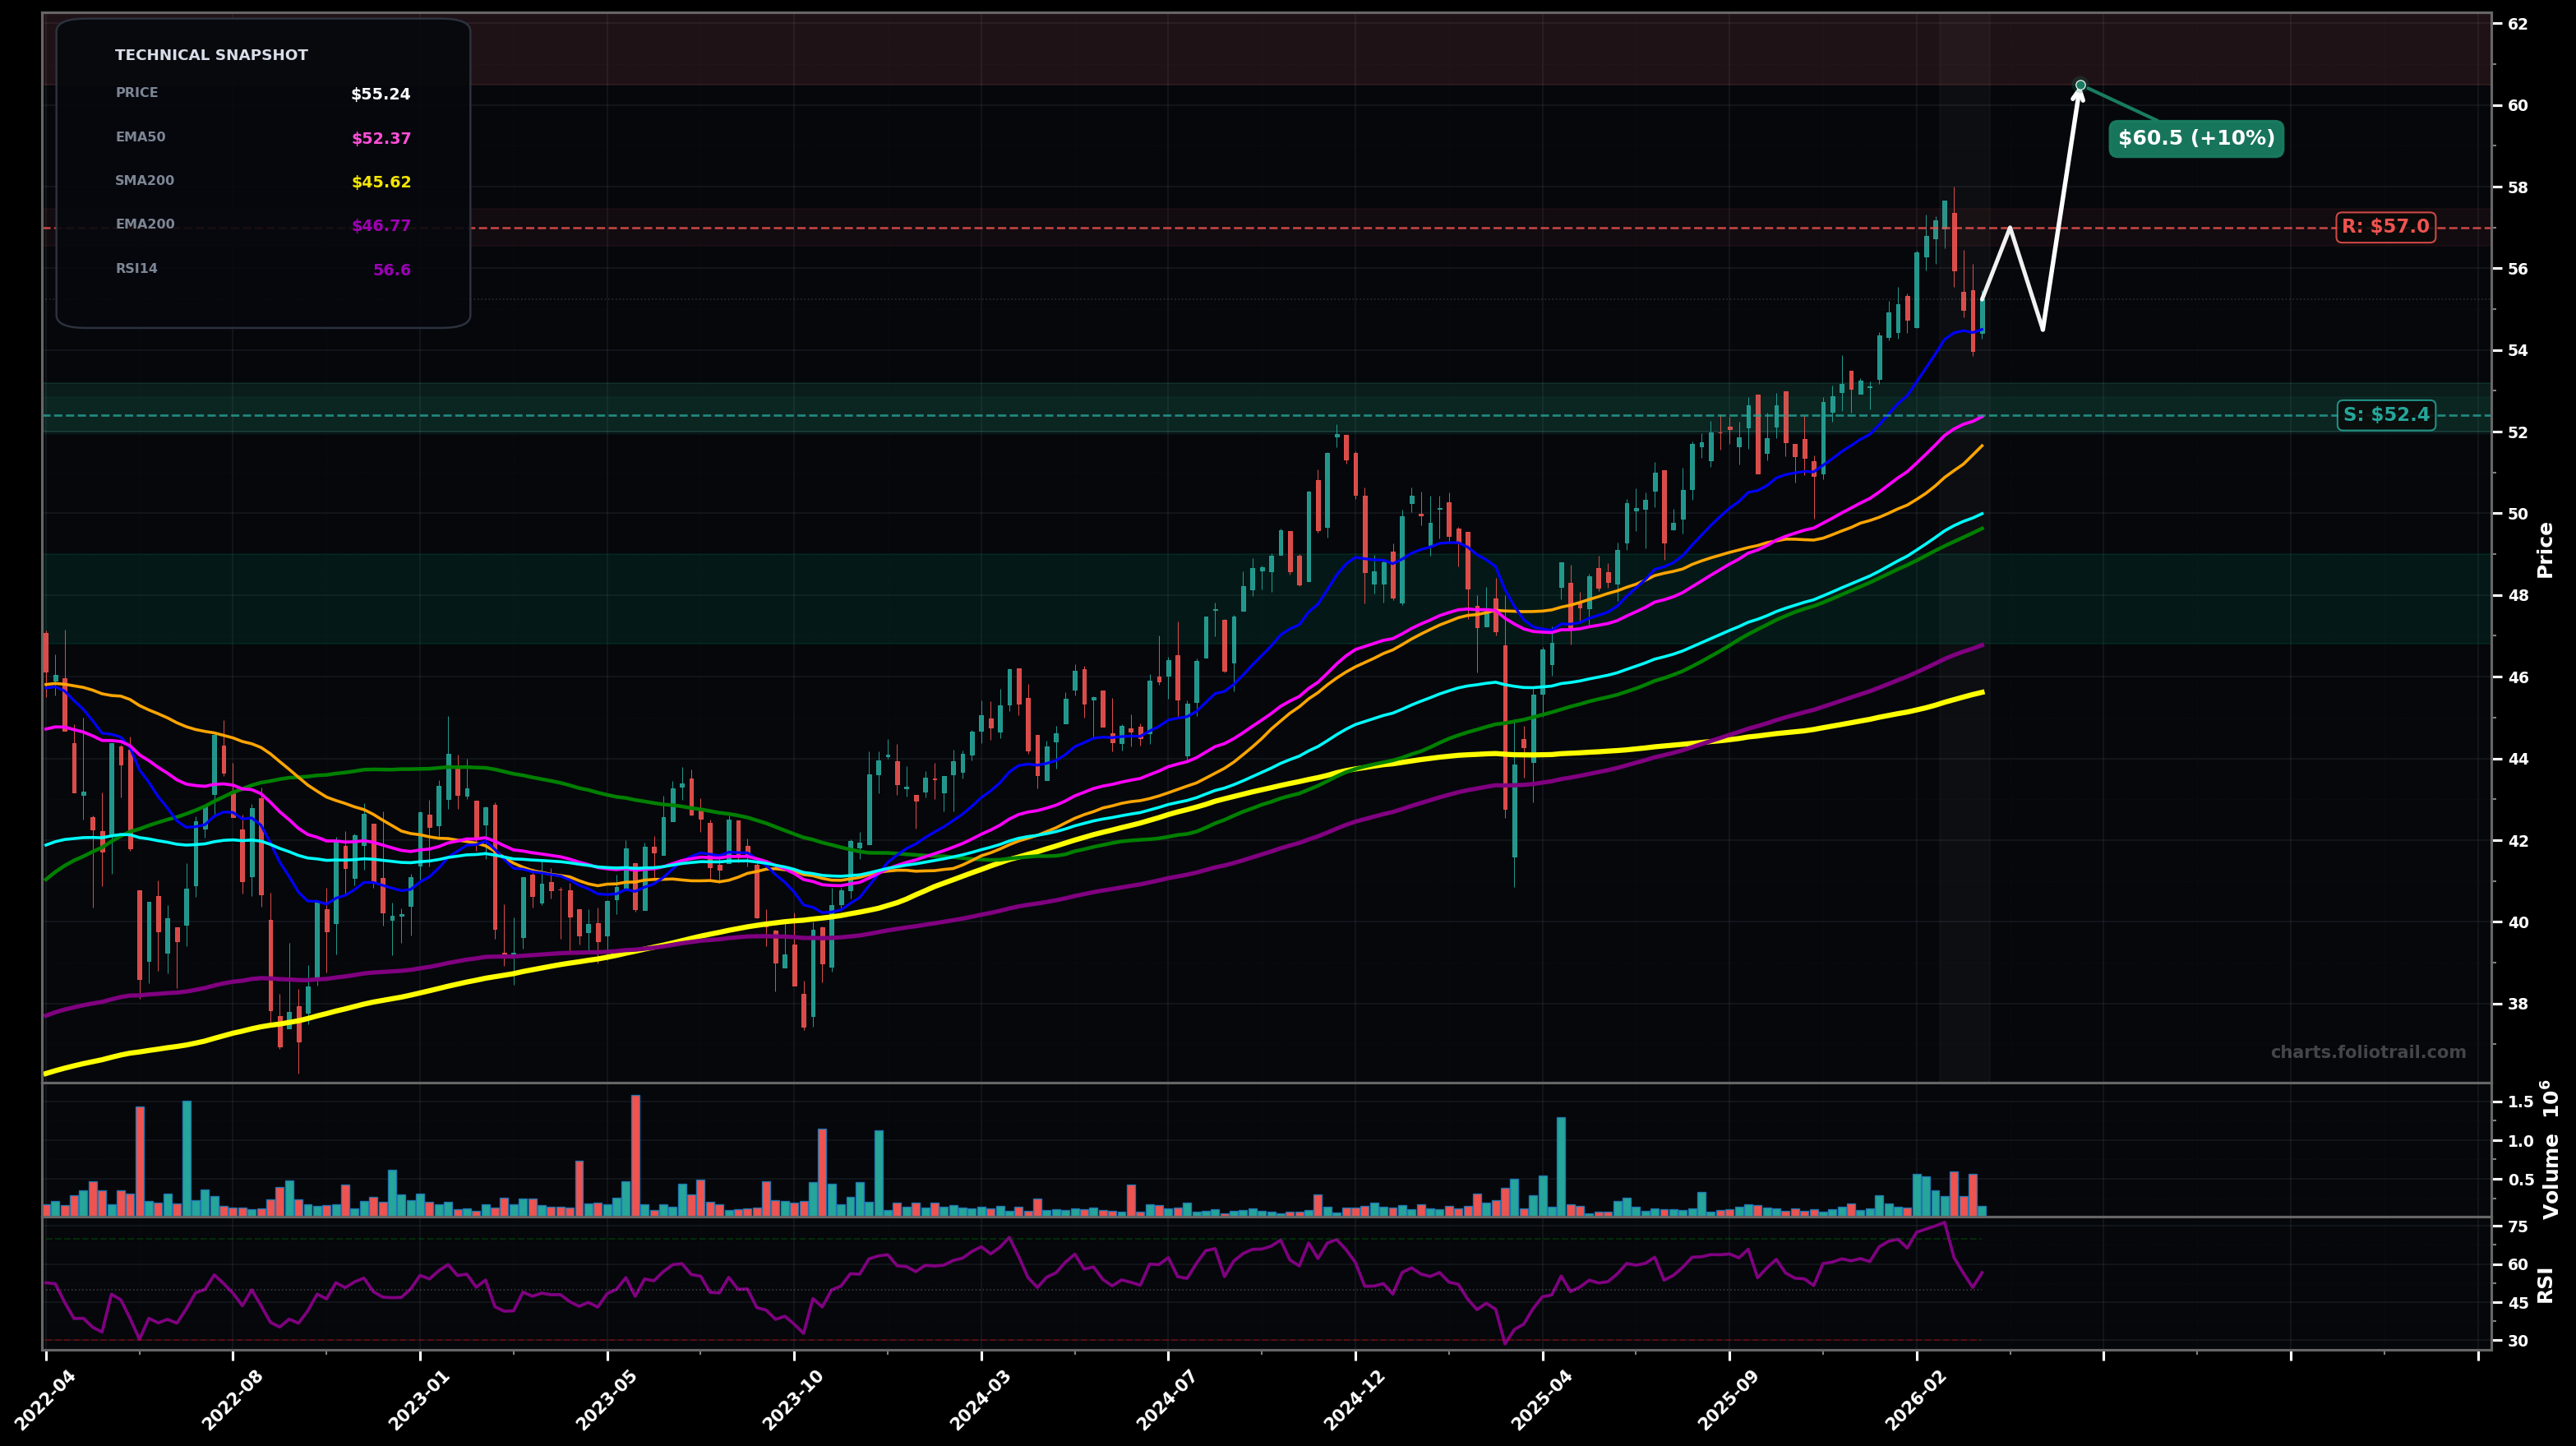
As of March 26, 2026, EQAL (Invesco Russell 1000 Equal Weight ETF) is in a uptrend state on the weekly chart, with a confidence level of 72%. Key support is at $52.4 and key resistance at $57.0. Weekly uptrend pulled back from ~$57 swing high to ~$55, holding above rising EMA50 (~$52.37) with RSI ~56 (cooling, not broken).
Bullish continuation: pullback completes as a Wave-4 style correction; price holds EMA50 and pushes to new highs (Wave-5 extension). Fib view: last impulse ~$41->$57, a typical shallow retrace (0.236–0.382) aligns with ~$53.2–$50.9, supporting a higher-low attempt.
Deeper correction: momentum fades and EQAL mean-reverts toward the mid-pack MAs (EMA100/SMA50/SMA100 cluster). Elliott view: Wave-5 already peaked near ~$57 and price is starting an A-B-C pullback; watch for a higher low vs the prior key pivot zone.
Weekly close back above $56.50 (reclaim of pullback zone) would confirm trend continuation
Weekly close below $52.00 (loss of EMA50 + swing structure risk) would invalidate the clean uptrend setup
Start near Fib 0.236–0.382 + EMA50 support; add on EMA100/SMA50 confluence; heavy add only on deep mean-reversion toward EMA200/SMA200 zone while keeping long-term uptrend context.
Trim into upside extensions above prior high (likely Wave-5 stretch) and progressively reduce as price becomes increasingly extended above EMA50/EMA100 and prior resistance zones.
As of March 26, 2026, EQAL (Invesco Russell 1000 Equal Weight ETF) is in a uptrend state on the weekly chart with 72% confidence. Weekly uptrend pulled back from ~$57 swing high to ~$55, holding above rising EMA50 (~$52.37) with RSI ~56 (cooling, not broken).
On the weekly timeframe, EQAL has key support at $52.4 and key resistance at $57.0. The most likely scenario (bullish) targets $57.0 and $60.5, with a revert level at $54.5.
EQAL (Invesco Russell 1000 Equal Weight ETF) is currently classified as uptrend on the weekly chart, with 72% confidence. Confirmation requires: Weekly close back above $56.50 (reclaim of pullback zone) would confirm trend continuation This would be invalidated by: Weekly close below $52.00 (loss of EMA50 + swing structure risk) would invalidate the clean uptrend setup
The most likely scenario (bullish) targets $57.0 and $60.5, with a revert level at $54.5. The alternative scenario (bearish) targets $52.0 and $50.0.
Multi-layer AI agents analyse 200+ stocks across daily, weekly, and monthly timeframes — producing market state classifications, price scenarios with targets, and position entry/exit levels. Updated every trading day after market close. No paywall. No sign-up required.
Built by Foliotrail.
All content on this website — including charts, analysis, price targets, support/resistance levels, and position zones — is generated entirely by AI and provided for educational and informational purposes only.
This is not financial advice. NEXUSNOIR VENTURES SL (the operator of this website) is not a registered investment adviser or broker-dealer. You should not make investment decisions based solely on this information. Always do your own research and consult a qualified financial advisor.
By continuing, you acknowledge that you have read and agree to our full disclaimer & terms of use and privacy policy.