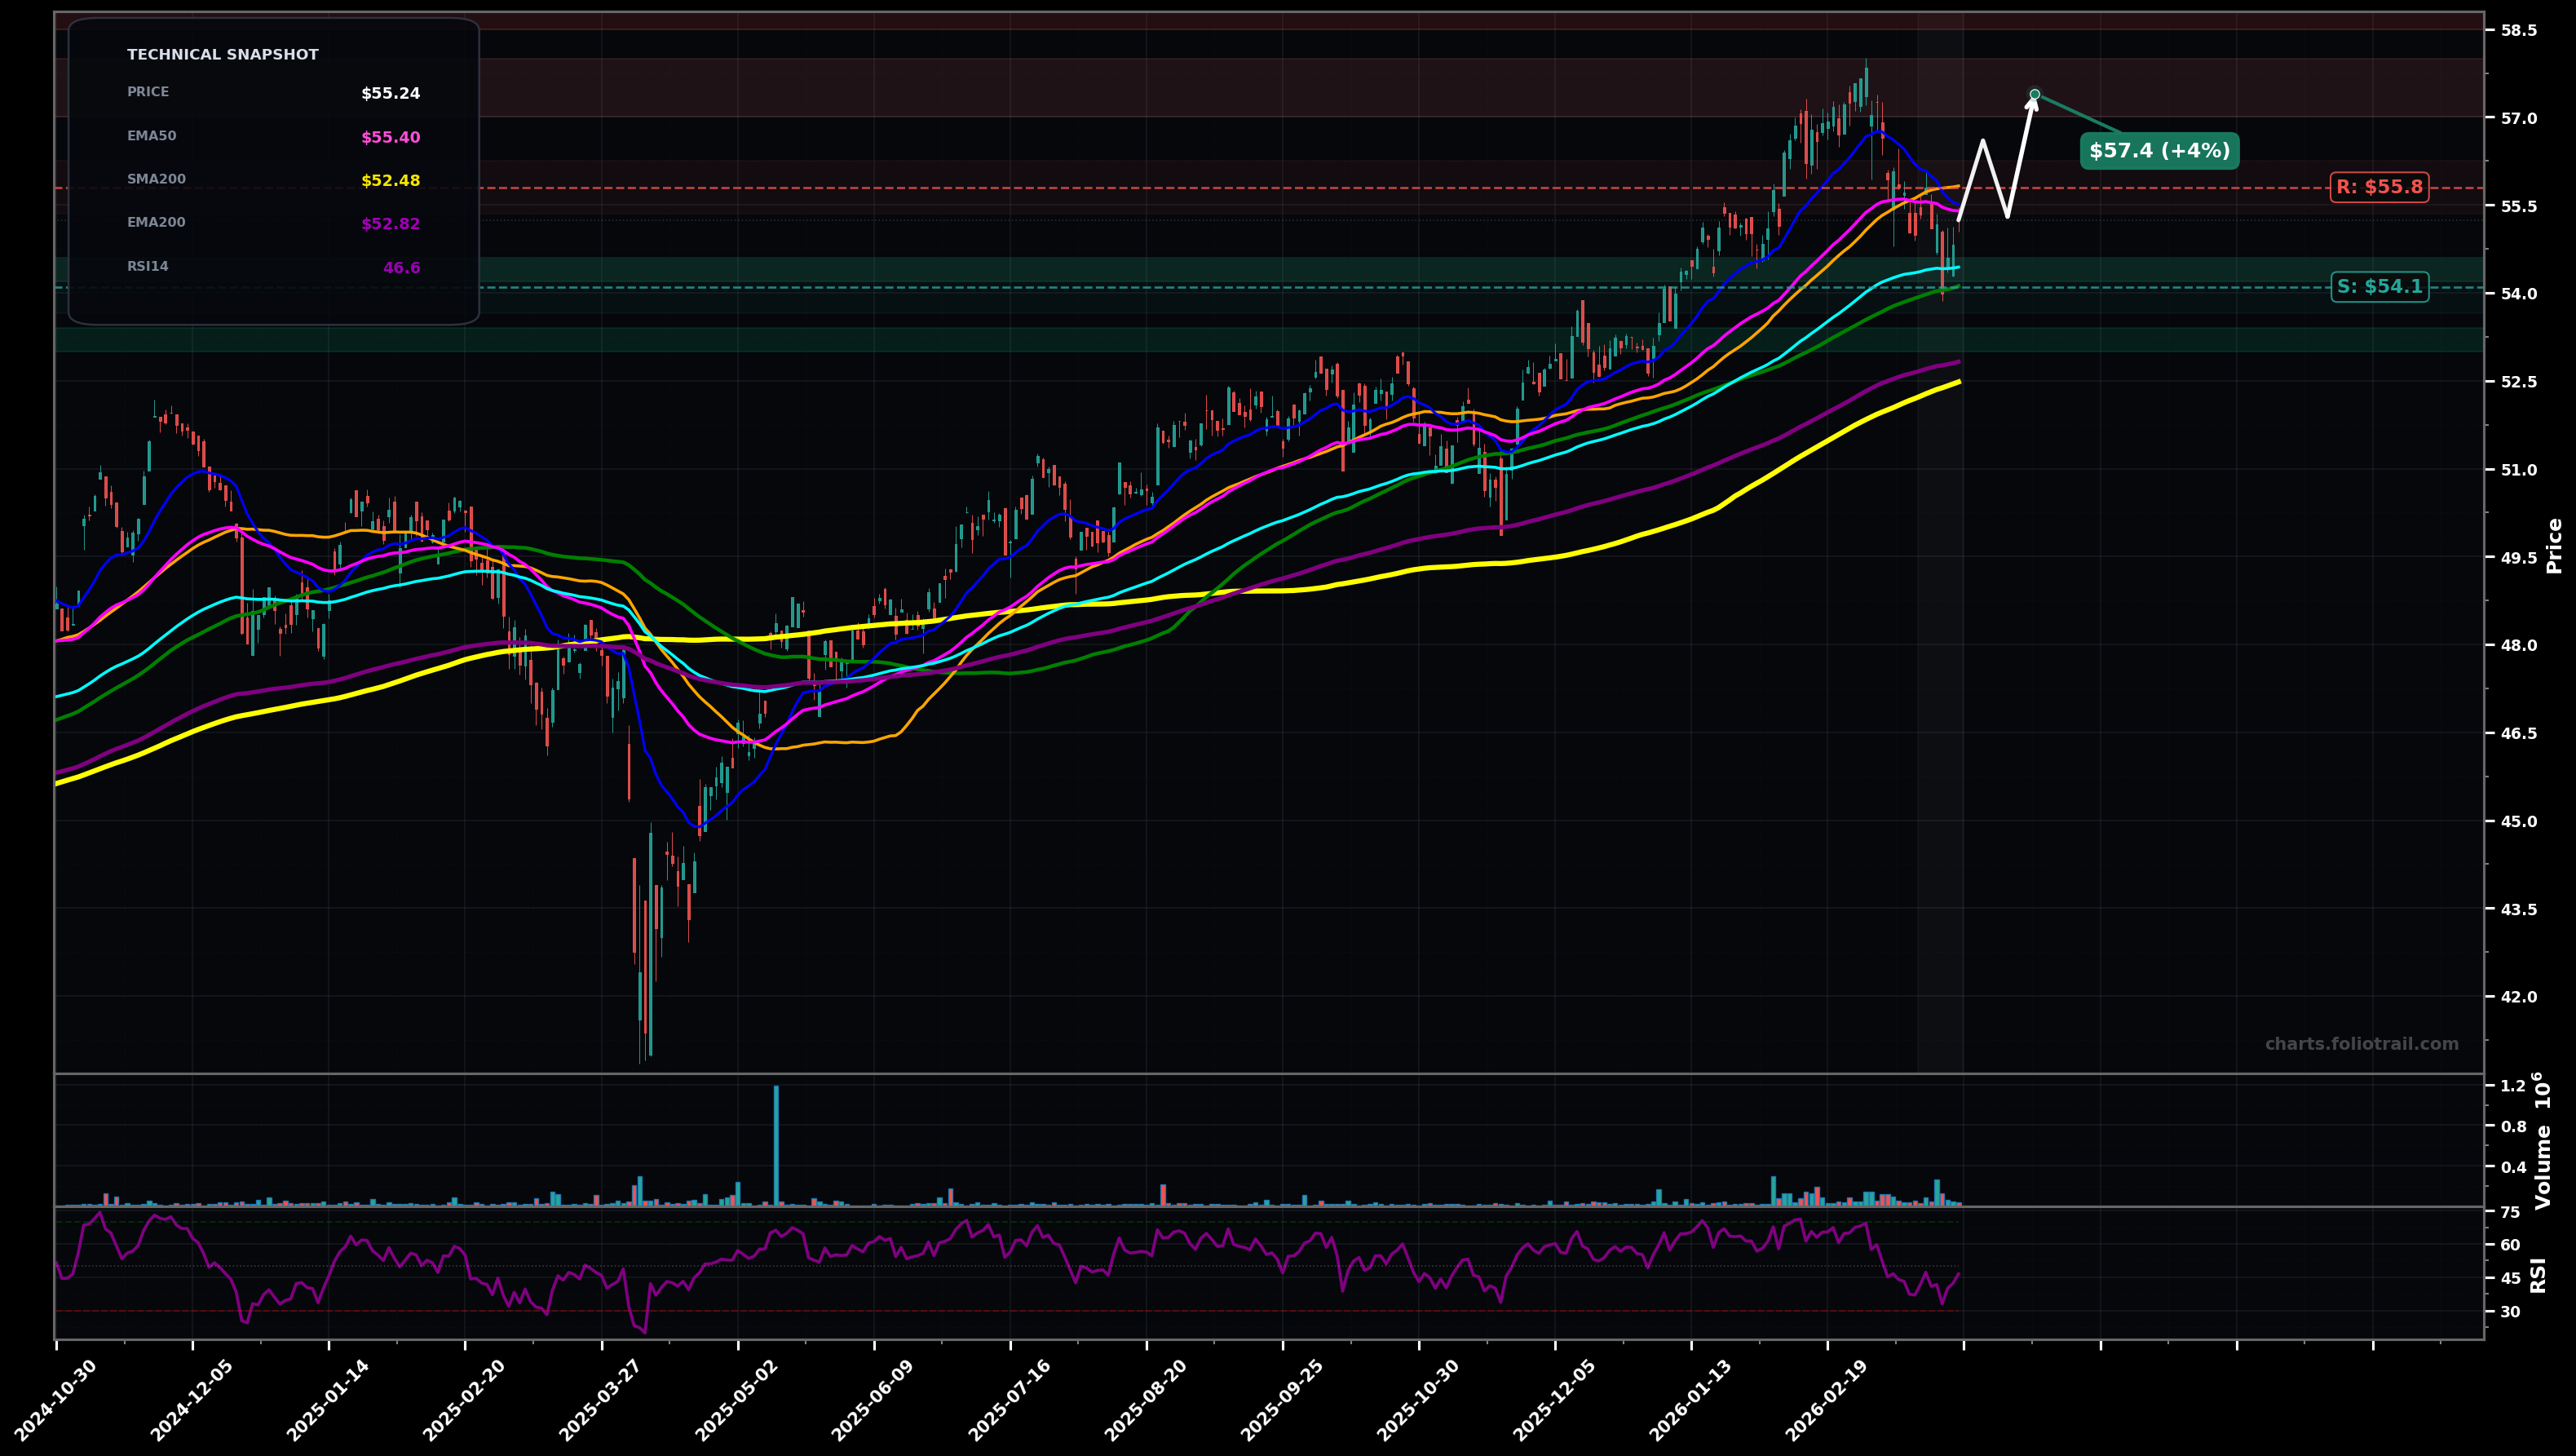
As of March 26, 2026, EQAL (Invesco Russell 1000 Equal Weight ETF) is in a choppy range state on the daily chart, with a confidence level of 63%. Key support is at $54.1 and key resistance at $55.8. After a strong multi-month advance, price pulled back from the ~$57 area and is now consolidating around ~$55, sitting below the fast MAs (SMA50/EMA20) but still above the rising mid/long-term averages (EMA50/EMA100/SMA100/SMA200).
Base-building above the $54.10–$54.40 moving-average cluster, then reclaim $55.80 and grind back toward prior highs; this fits an Elliott Wave pause/correction (wave 4) before a potential final push (wave 5).
Failure to hold the $54.10–$54.40 area leads to a deeper retrace toward the higher-timeframe support band (EMA200/SMA200 region), consistent with a larger ABC correction; buyers likely reappear near the long MAs.
2+ daily closes holding above $55.80 (SMA50) would confirm a bullish range-break attempt
A daily close below $54.10 (SMA100) would invalidate the choppy-range thesis and shift toward a deeper pullback
Start near SMA100/EMA100 support, add on breakdown-and-stabilize toward $53, heavy add at SMA200/EMA200 where trend support is strongest.
Trim into prior-high extension ($57+) and increasing distance from the MA cluster; larger trims/exit if price becomes materially stretched above the rising long-term averages.
As of March 26, 2026, EQAL (Invesco Russell 1000 Equal Weight ETF) is in a choppy range state on the daily chart with 63% confidence. After a strong multi-month advance, price pulled back from the ~$57 area and is now consolidating around ~$55, sitting below the fast MAs (SMA50/EMA20) but still above the rising mid/long-term averages (EMA50/EMA100/SMA100/SMA200).
On the daily timeframe, EQAL has key support at $54.1 and key resistance at $55.8. The most likely scenario (bullish) targets $56.6 and $57.4, with a revert level at $55.3.
EQAL (Invesco Russell 1000 Equal Weight ETF) is currently classified as choppy range on the daily chart, with 63% confidence. Confirmation requires: 2+ daily closes holding above $55.80 (SMA50) would confirm a bullish range-break attempt This would be invalidated by: A daily close below $54.10 (SMA100) would invalidate the choppy-range thesis and shift toward a deeper pullback
The most likely scenario (bullish) targets $56.6 and $57.4, with a revert level at $55.3. The alternative scenario (bearish) targets $53.0 and $52.5.
Multi-layer AI agents analyse 200+ stocks across daily, weekly, and monthly timeframes — producing market state classifications, price scenarios with targets, and position entry/exit levels. Updated every trading day after market close. No paywall. No sign-up required.
Built by Foliotrail.
All content on this website — including charts, analysis, price targets, support/resistance levels, and position zones — is generated entirely by AI and provided for educational and informational purposes only.
This is not financial advice. NEXUSNOIR VENTURES SL (the operator of this website) is not a registered investment adviser or broker-dealer. You should not make investment decisions based solely on this information. Always do your own research and consult a qualified financial advisor.
By continuing, you acknowledge that you have read and agree to our full disclaimer & terms of use and privacy policy.