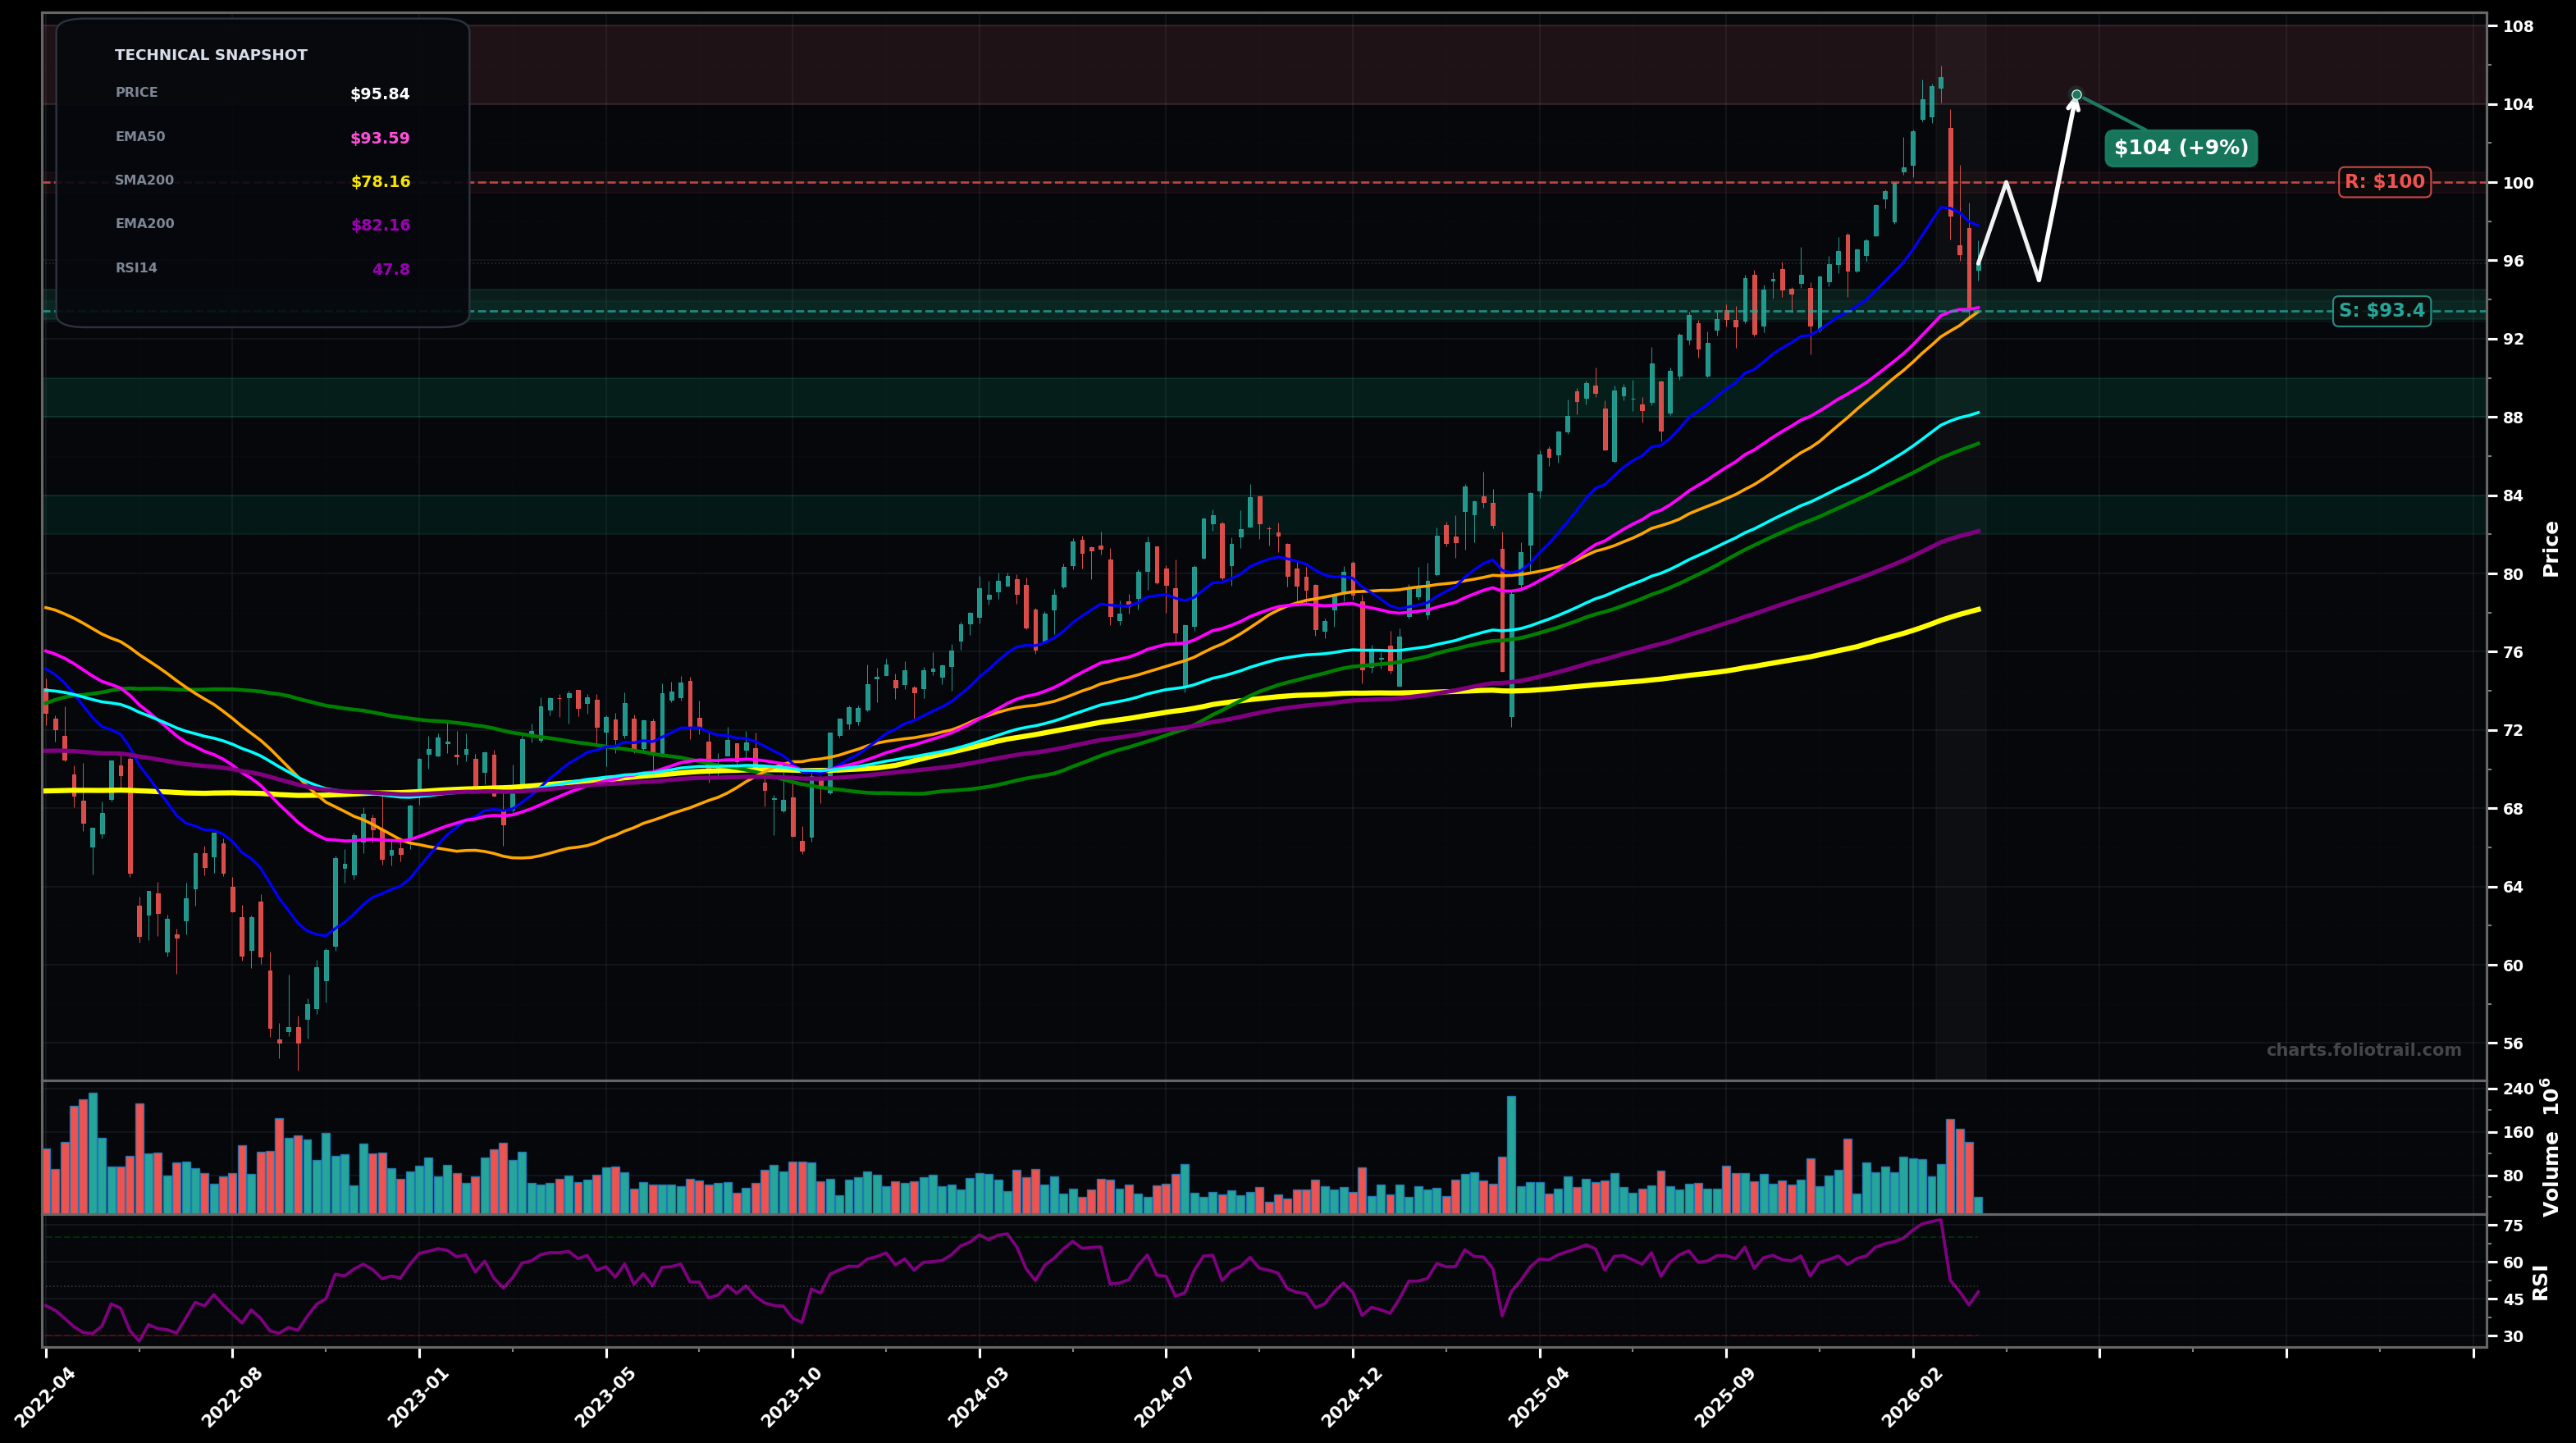
As of March 24, 2026, EFA (iShares MSCI EAFE ETF) is in a uptrend state on the weekly chart, with a confidence level of 66%. Key support is at $93.4 and key resistance at $100. Weekly uptrend pulled back sharply from the $104–$105 area; price ~$95.84 is still above rising EMA50 (~$93.59) and SMA50 (~$93.38), with RSI14 ~47.8 (cooling momentum).
Bullish continuation after a shallow wave-4 style pullback: price holds the $93–$94 cluster (EMA50/SMA50) then reclaims $98–$100, setting up a retest of the prior swing high. (Elliott: likely in Wave 5 attempt; Fib: pullback is consistent with a ~23.6–38.2% retrace of the last impulse leg.)
Deeper corrective pullback: failure to reclaim $98–$100 and a weekly close below $93 triggers a move toward the next MA confluence (EMA100/cyan and SMA100/green), typical of a Wave-4 deeper retrace before any renewed uptrend. (Fib: aligns with ~38.2–50% retrace of the late-2024 to 2025 advance.)
Weekly close back above $98.00 and then a break/close above $100.00
Weekly close below $93.00 (loss of EMA50/SMA50 area and prior breakout shelf)
Start near EMA50/SMA50 support; add at EMA100/SMA100 confluence; heavy add near EMA200 (~$82.16) where long-term trend support typically attracts buyers if correction deepens.
Trim into prior ATH supply ($104+) and into any extended Wave-5 / Fib-extension zones; close if price becomes multi-year stretched well above the rising long MAs (distance/mean-reversion risk elevated).
As of March 24, 2026, EFA (iShares MSCI EAFE ETF) is in a uptrend state on the weekly chart with 66% confidence. Weekly uptrend pulled back sharply from the $104–$105 area; price ~$95.84 is still above rising EMA50 (~$93.59) and SMA50 (~$93.38), with RSI14 ~47.8 (cooling momentum).
On the weekly timeframe, EFA has key support at $93.4 and key resistance at $100. The most likely scenario (bullish) targets $100 and $104, with a revert level at $95.0.
EFA (iShares MSCI EAFE ETF) is currently classified as uptrend on the weekly chart, with 66% confidence. Confirmation requires: Weekly close back above $98.00 and then a break/close above $100.00 This would be invalidated by: Weekly close below $93.00 (loss of EMA50/SMA50 area and prior breakout shelf)
The most likely scenario (bullish) targets $100 and $104, with a revert level at $95.0. The alternative scenario (bearish) targets $88.2 and $86.6.
All content on this website — including charts, analysis, price targets, support/resistance levels, and position zones — is generated entirely by AI and provided for educational and informational purposes only.
This is not financial advice. NEXUSNOIR VENTURES SL (the operator of this website) is not a registered investment adviser or broker-dealer. You should not make investment decisions based solely on this information. Always do your own research and consult a qualified financial advisor.
By continuing, you acknowledge that you have read and agree to our full disclaimer & terms of use and privacy policy.