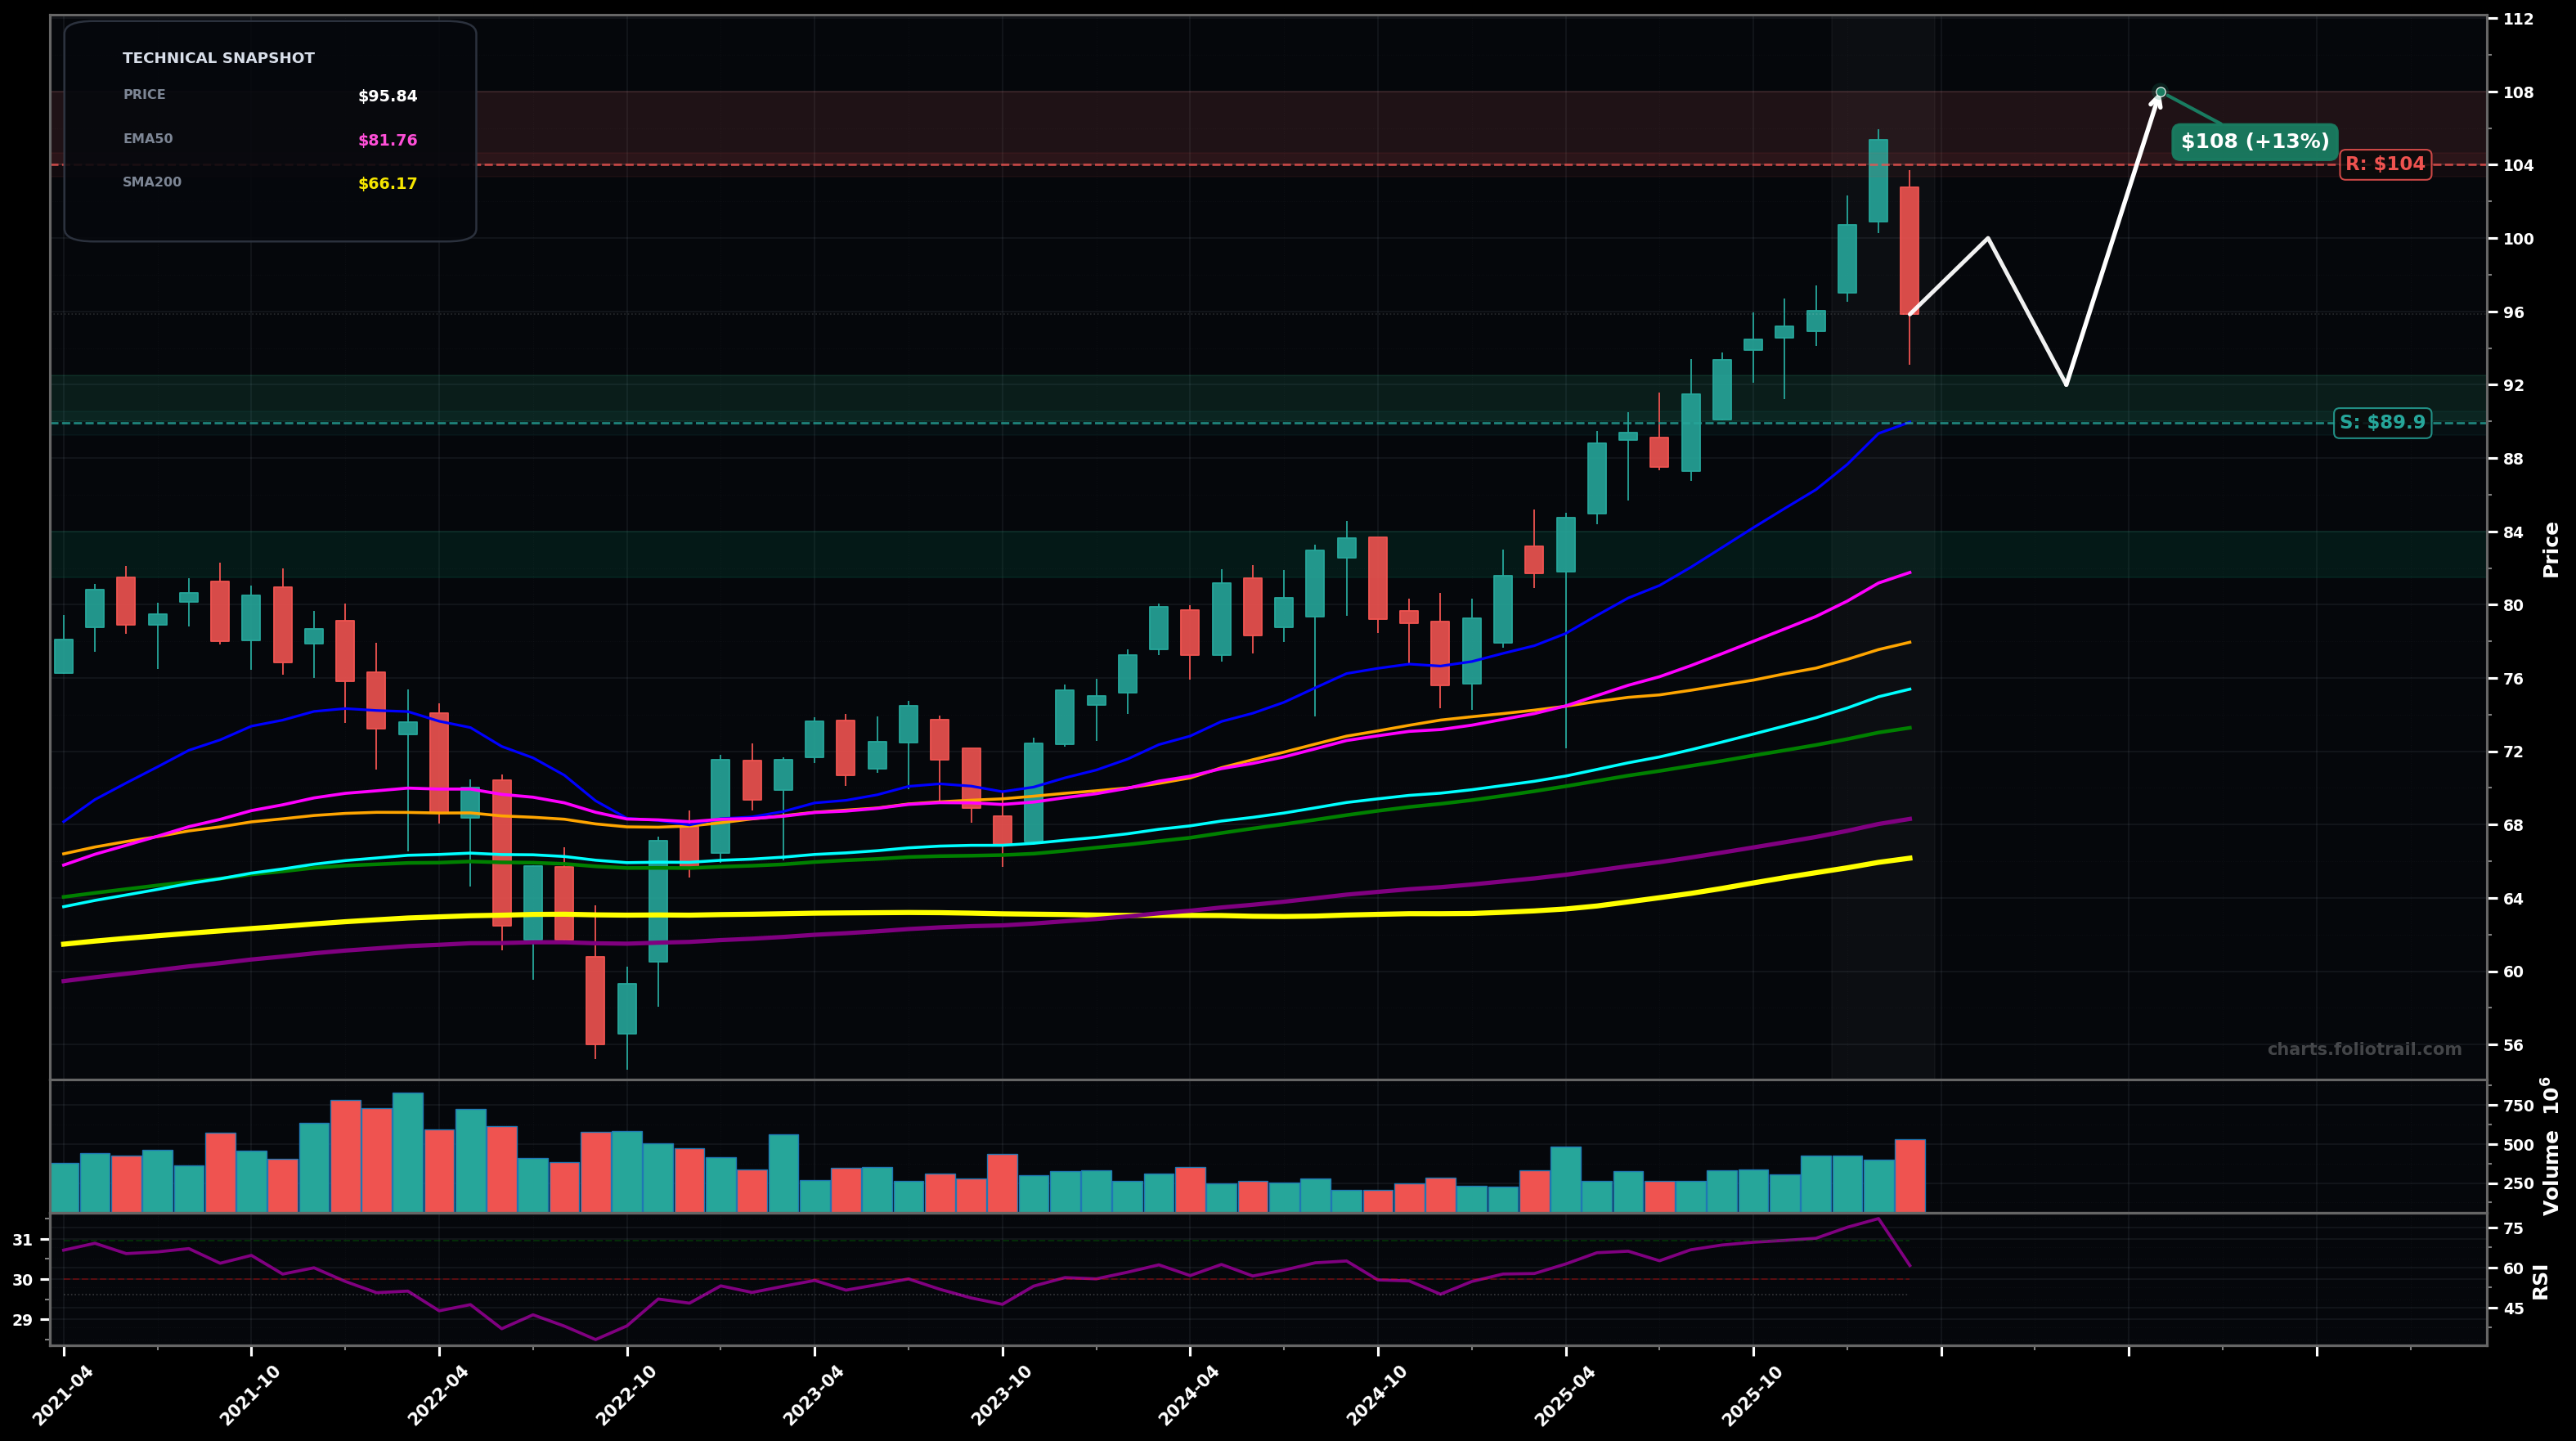
As of March 24, 2026, EFA (iShares MSCI EAFE ETF) is in a uptrend state on the monthly chart, with a confidence level of 72%. Key support is at $89.9 and key resistance at $104. Strong multi-month rally to new swing high near ~$104 followed by a sharp pullback to ~$95.84 (first notable monthly red after extension).
Bullish continuation: pullback holds above ~$89.90, then price grinds back through ~$100 and retests the ~$104 swing high; if broken, extension continues.
Deeper correction: failure to reclaim ~$100 quickly leads to a breakdown below ~$89.90, forcing a mean reversion toward the rising EMA50/SMA50 cluster before buyers re-engage.
Monthly close back above ~$100.00 (reclaim round-number supply and prior breakout area).
Monthly close below ~$89.90 (loss of the most recent swing-low reference / EMA20 area).
Start near the ~$89.9 swing-low/EMA20 support; add on breakdown toward prior consolidation and rising trend support; heavy add near EMA50 (~$81.8) where trend mean-reversion is likely if the primary uptrend remains intact.
Trim into prior swing-high supply (~$104) and any breakout extension; heavier trims as price becomes increasingly stretched above EMA50/EMA100; full close zone reserved for a euphoric multi-year extension well above the MA stack.
As of March 24, 2026, EFA (iShares MSCI EAFE ETF) is in a uptrend state on the monthly chart with 72% confidence. Strong multi-month rally to new swing high near ~$104 followed by a sharp pullback to ~$95.84 (first notable monthly red after extension).
On the monthly timeframe, EFA has key support at $89.9 and key resistance at $104. The most likely scenario (bullish) targets $100 and $108, with a revert level at $92.0.
EFA (iShares MSCI EAFE ETF) is currently classified as uptrend on the monthly chart, with 72% confidence. Confirmation requires: Monthly close back above ~$100.00 (reclaim round-number supply and prior breakout area). This would be invalidated by: Monthly close below ~$89.90 (loss of the most recent swing-low reference / EMA20 area).
The most likely scenario (bullish) targets $100 and $108, with a revert level at $92.0. The alternative scenario (bearish) targets $86.0 and $81.8.
All content on this website — including charts, analysis, price targets, support/resistance levels, and position zones — is generated entirely by AI and provided for educational and informational purposes only.
This is not financial advice. NEXUSNOIR VENTURES SL (the operator of this website) is not a registered investment adviser or broker-dealer. You should not make investment decisions based solely on this information. Always do your own research and consult a qualified financial advisor.
By continuing, you acknowledge that you have read and agree to our full disclaimer & terms of use and privacy policy.