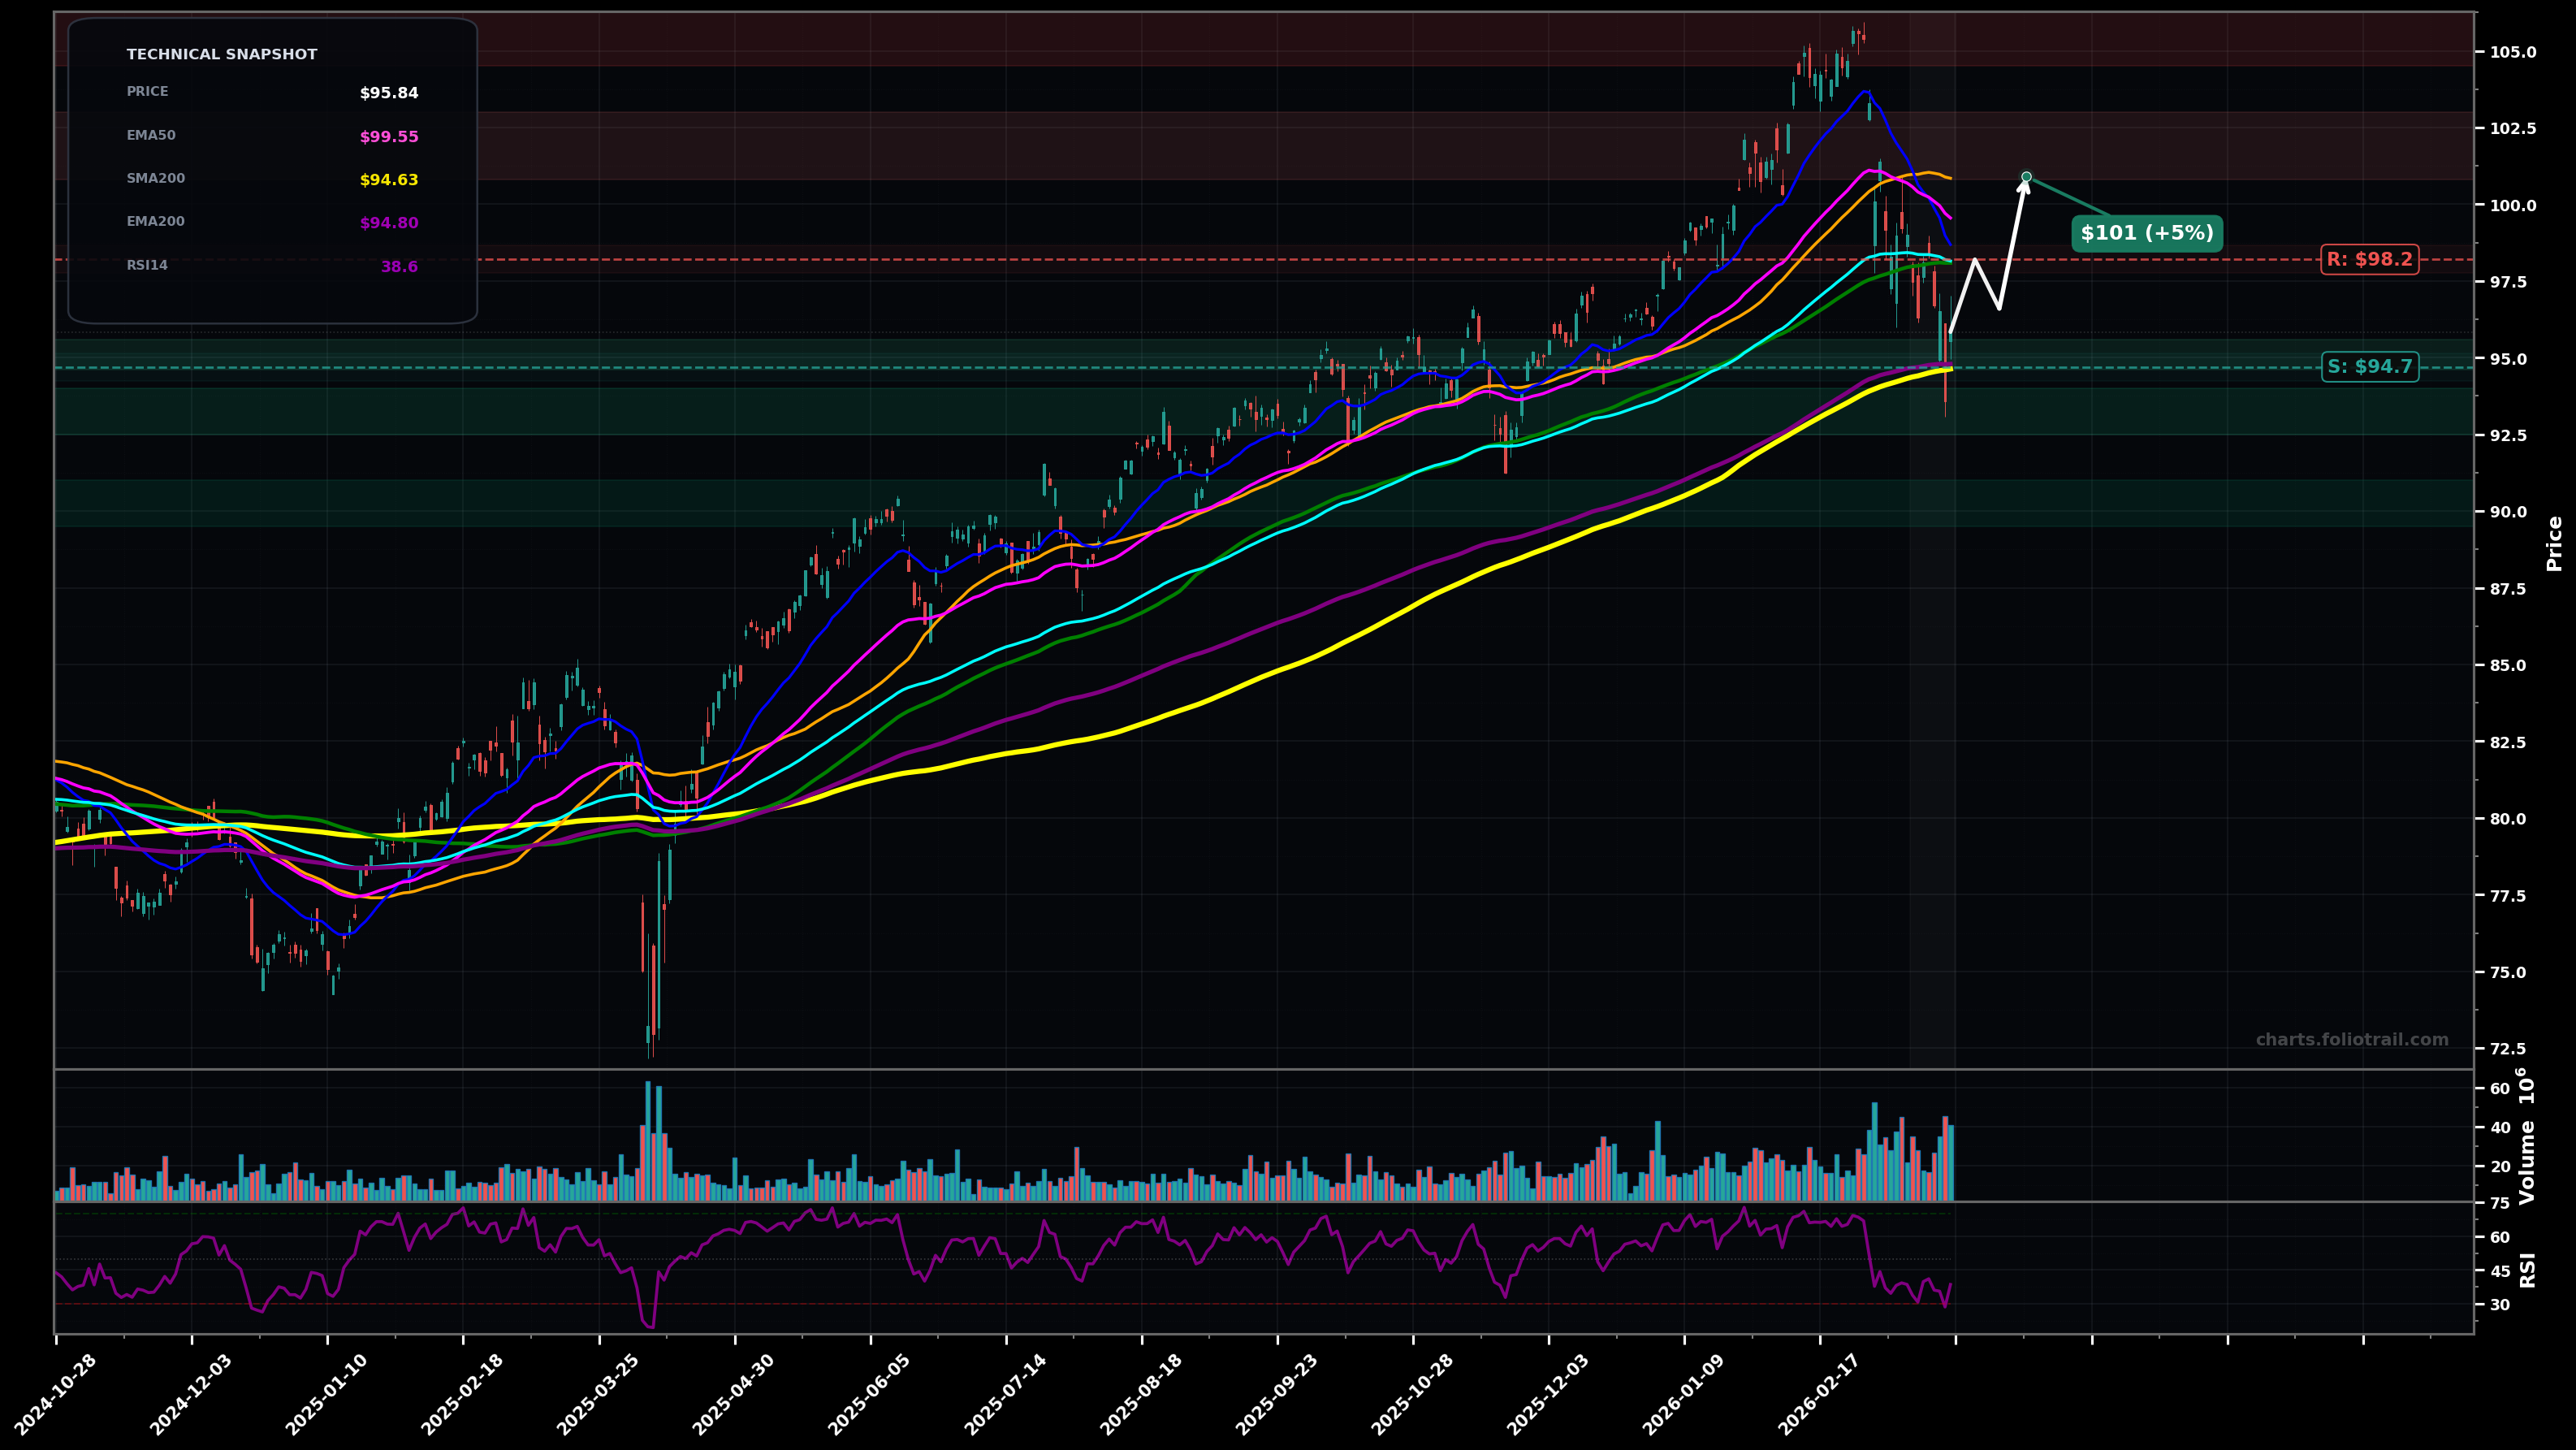
As of March 24, 2026, EFA (iShares MSCI EAFE ETF) is in a bottoming attempt state on the daily chart, with a confidence level of 58%. Key support is at $94.7 and key resistance at $98.2. Sharp selloff from ~$105–$106 highs with high volume; price dumped through SMA50/100 and EMA50/100 and tagged the rising SMA200/EMA200 zone, then bounced to ~$95.84; RSI(14) ~38 (weak momentum).
Base-building above the 200-day band: price chops/holds $94.5–$96, then mean-reverts to reclaim EMA100 and tests the prior breakdown area near $100–$101 (typical Wave 4-style consolidation after a completed Wave 5/extension). Rough probability: 60%.
Failure of the 200-day band: another volatility expansion leg down (capitulation-style) to the next fib/support pocket, then a reflex rally back toward the broken $95 zone. Rough probability: 40%.
Daily close back above EMA100 (cyan) ~$98.15 with 2+ holds
Daily close below the 200-day band (SMA200/EMA200) <$94.50
Start near the confluence of SMA200/EMA200 support; add on a controlled undercut to the next support/fib pocket; heavy add only on washout into ~$90 where a larger degree Wave 2/4-style retrace would likely be complete.
Trim into the first reclaim/mean-reversion zone (SMA50/EMA50 area), trim more into the prior ATH supply (~$105–$106), and fully close only if price becomes extended beyond prior highs (possible Wave 5 extension) where risk/reward degrades.
As of March 24, 2026, EFA (iShares MSCI EAFE ETF) is in a bottoming attempt state on the daily chart with 58% confidence. Sharp selloff from ~$105–$106 highs with high volume; price dumped through SMA50/100 and EMA50/100 and tagged the rising SMA200/EMA200 zone, then bounced to ~$95.84; RSI(14) ~38 (weak momentum).
On the daily timeframe, EFA has key support at $94.7 and key resistance at $98.2. The most likely scenario (bullish) targets $98.2 and $101, with a revert level at $96.6.
EFA (iShares MSCI EAFE ETF) is currently classified as bottoming attempt on the daily chart, with 58% confidence. Confirmation requires: Daily close back above EMA100 (cyan) ~$98.15 with 2+ holds This would be invalidated by: Daily close below the 200-day band (SMA200/EMA200) <$94.50
The most likely scenario (bullish) targets $98.2 and $101, with a revert level at $96.6. The alternative scenario (bearish) targets $92.5 and $90.0.
All content on this website — including charts, analysis, price targets, support/resistance levels, and position zones — is generated entirely by AI and provided for educational and informational purposes only.
This is not financial advice. NEXUSNOIR VENTURES SL (the operator of this website) is not a registered investment adviser or broker-dealer. You should not make investment decisions based solely on this information. Always do your own research and consult a qualified financial advisor.
By continuing, you acknowledge that you have read and agree to our full disclaimer & terms of use and privacy policy.