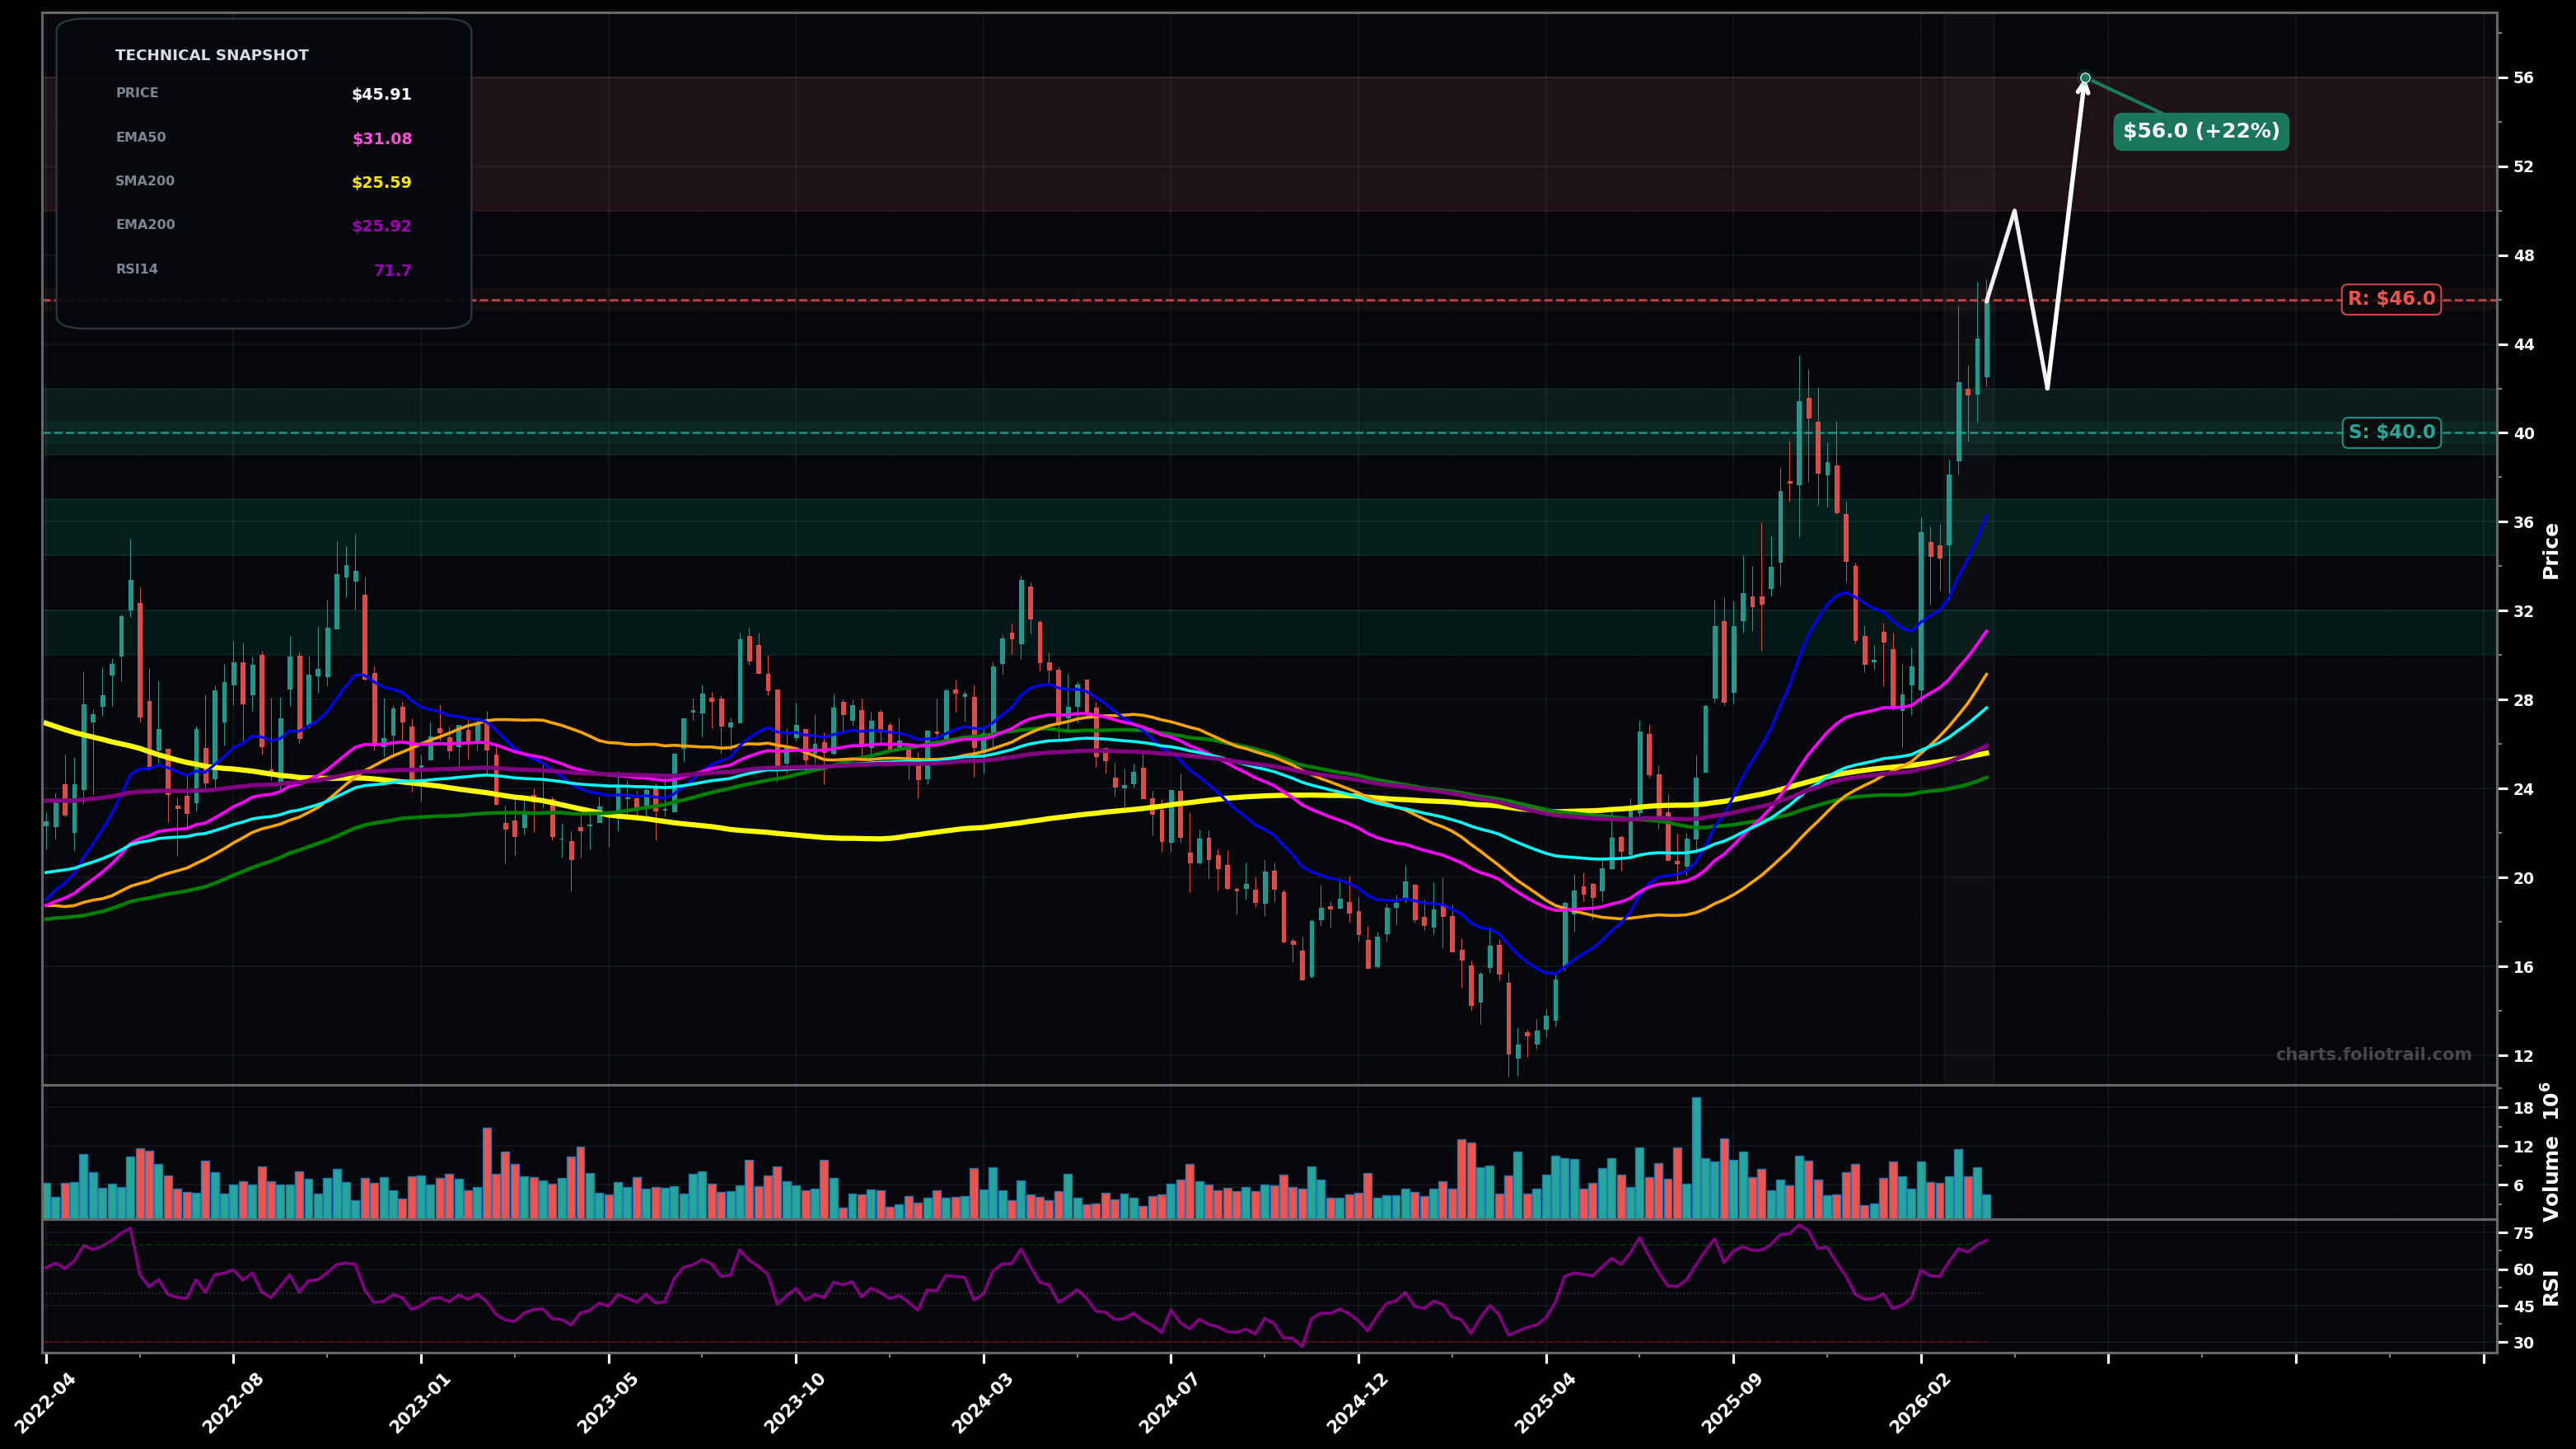
As of March 25, 2026, DK (Delek US Holdings Inc.) is in a uptrend state on the weekly chart, with a confidence level of 78%. Key support is at $40.0 and key resistance at $46.0. Weekly breakout to fresh swing highs (~$46) after a sharp V-rebound; price extended above all key MAs with RSI ~72 (overbought momentum).
Bullish continuation: brief pullback/consolidation (profit-taking with RSI cooling) then trend resumes; Elliott-wave read: likely in a Wave 3 extension or late Wave 3 with a shallow Wave 4 next.
Bearish shakeout: failed breakout (bull trap) with a deeper Wave 4 / larger ABC correction toward fast MAs; Fibonacci-style retrace zone likely ~38.2%–50% of the $12->$46 impulse.
Hold above $42.00 on weekly closes (2+ weeks) while maintaining HH/HL structure
Weekly close below $36.00 (loss of last breakout/impulse support and trend deterioration)
Buy-the-dip tiers aligned to prior breakout area (~$40–$42) then deeper retrace to prior structure + EMA50 (~$31) if a Wave 4/ABC expands.
Trim into psychological/$round levels and probable fib extensions of the $12->$46 impulse as price stretches far above EMA50/100 and RSI stays elevated.
As of March 25, 2026, DK (Delek US Holdings Inc.) is in a uptrend state on the weekly chart with 78% confidence. Weekly breakout to fresh swing highs (~$46) after a sharp V-rebound; price extended above all key MAs with RSI ~72 (overbought momentum).
On the weekly timeframe, DK has key support at $40.0 and key resistance at $46.0. The most likely scenario (bullish) targets $50.0 and $56.0, with a revert level at $42.0.
DK (Delek US Holdings Inc.) is currently classified as uptrend on the weekly chart, with 78% confidence. Confirmation requires: Hold above $42.00 on weekly closes (2+ weeks) while maintaining HH/HL structure This would be invalidated by: Weekly close below $36.00 (loss of last breakout/impulse support and trend deterioration)
The most likely scenario (bullish) targets $50.0 and $56.0, with a revert level at $42.0. The alternative scenario (bearish) targets $36.0 and $31.0.
Multi-layer AI agents analyse 200+ stocks across daily, weekly, and monthly timeframes — producing market state classifications, price scenarios with targets, and position entry/exit levels. Updated every trading day after market close. No paywall. No sign-up required.
Built by Foliotrail.
All content on this website — including charts, analysis, price targets, support/resistance levels, and position zones — is generated entirely by AI and provided for educational and informational purposes only.
This is not financial advice. NEXUSNOIR VENTURES SL (the operator of this website) is not a registered investment adviser or broker-dealer. You should not make investment decisions based solely on this information. Always do your own research and consult a qualified financial advisor.
By continuing, you acknowledge that you have read and agree to our full disclaimer & terms of use and privacy policy.