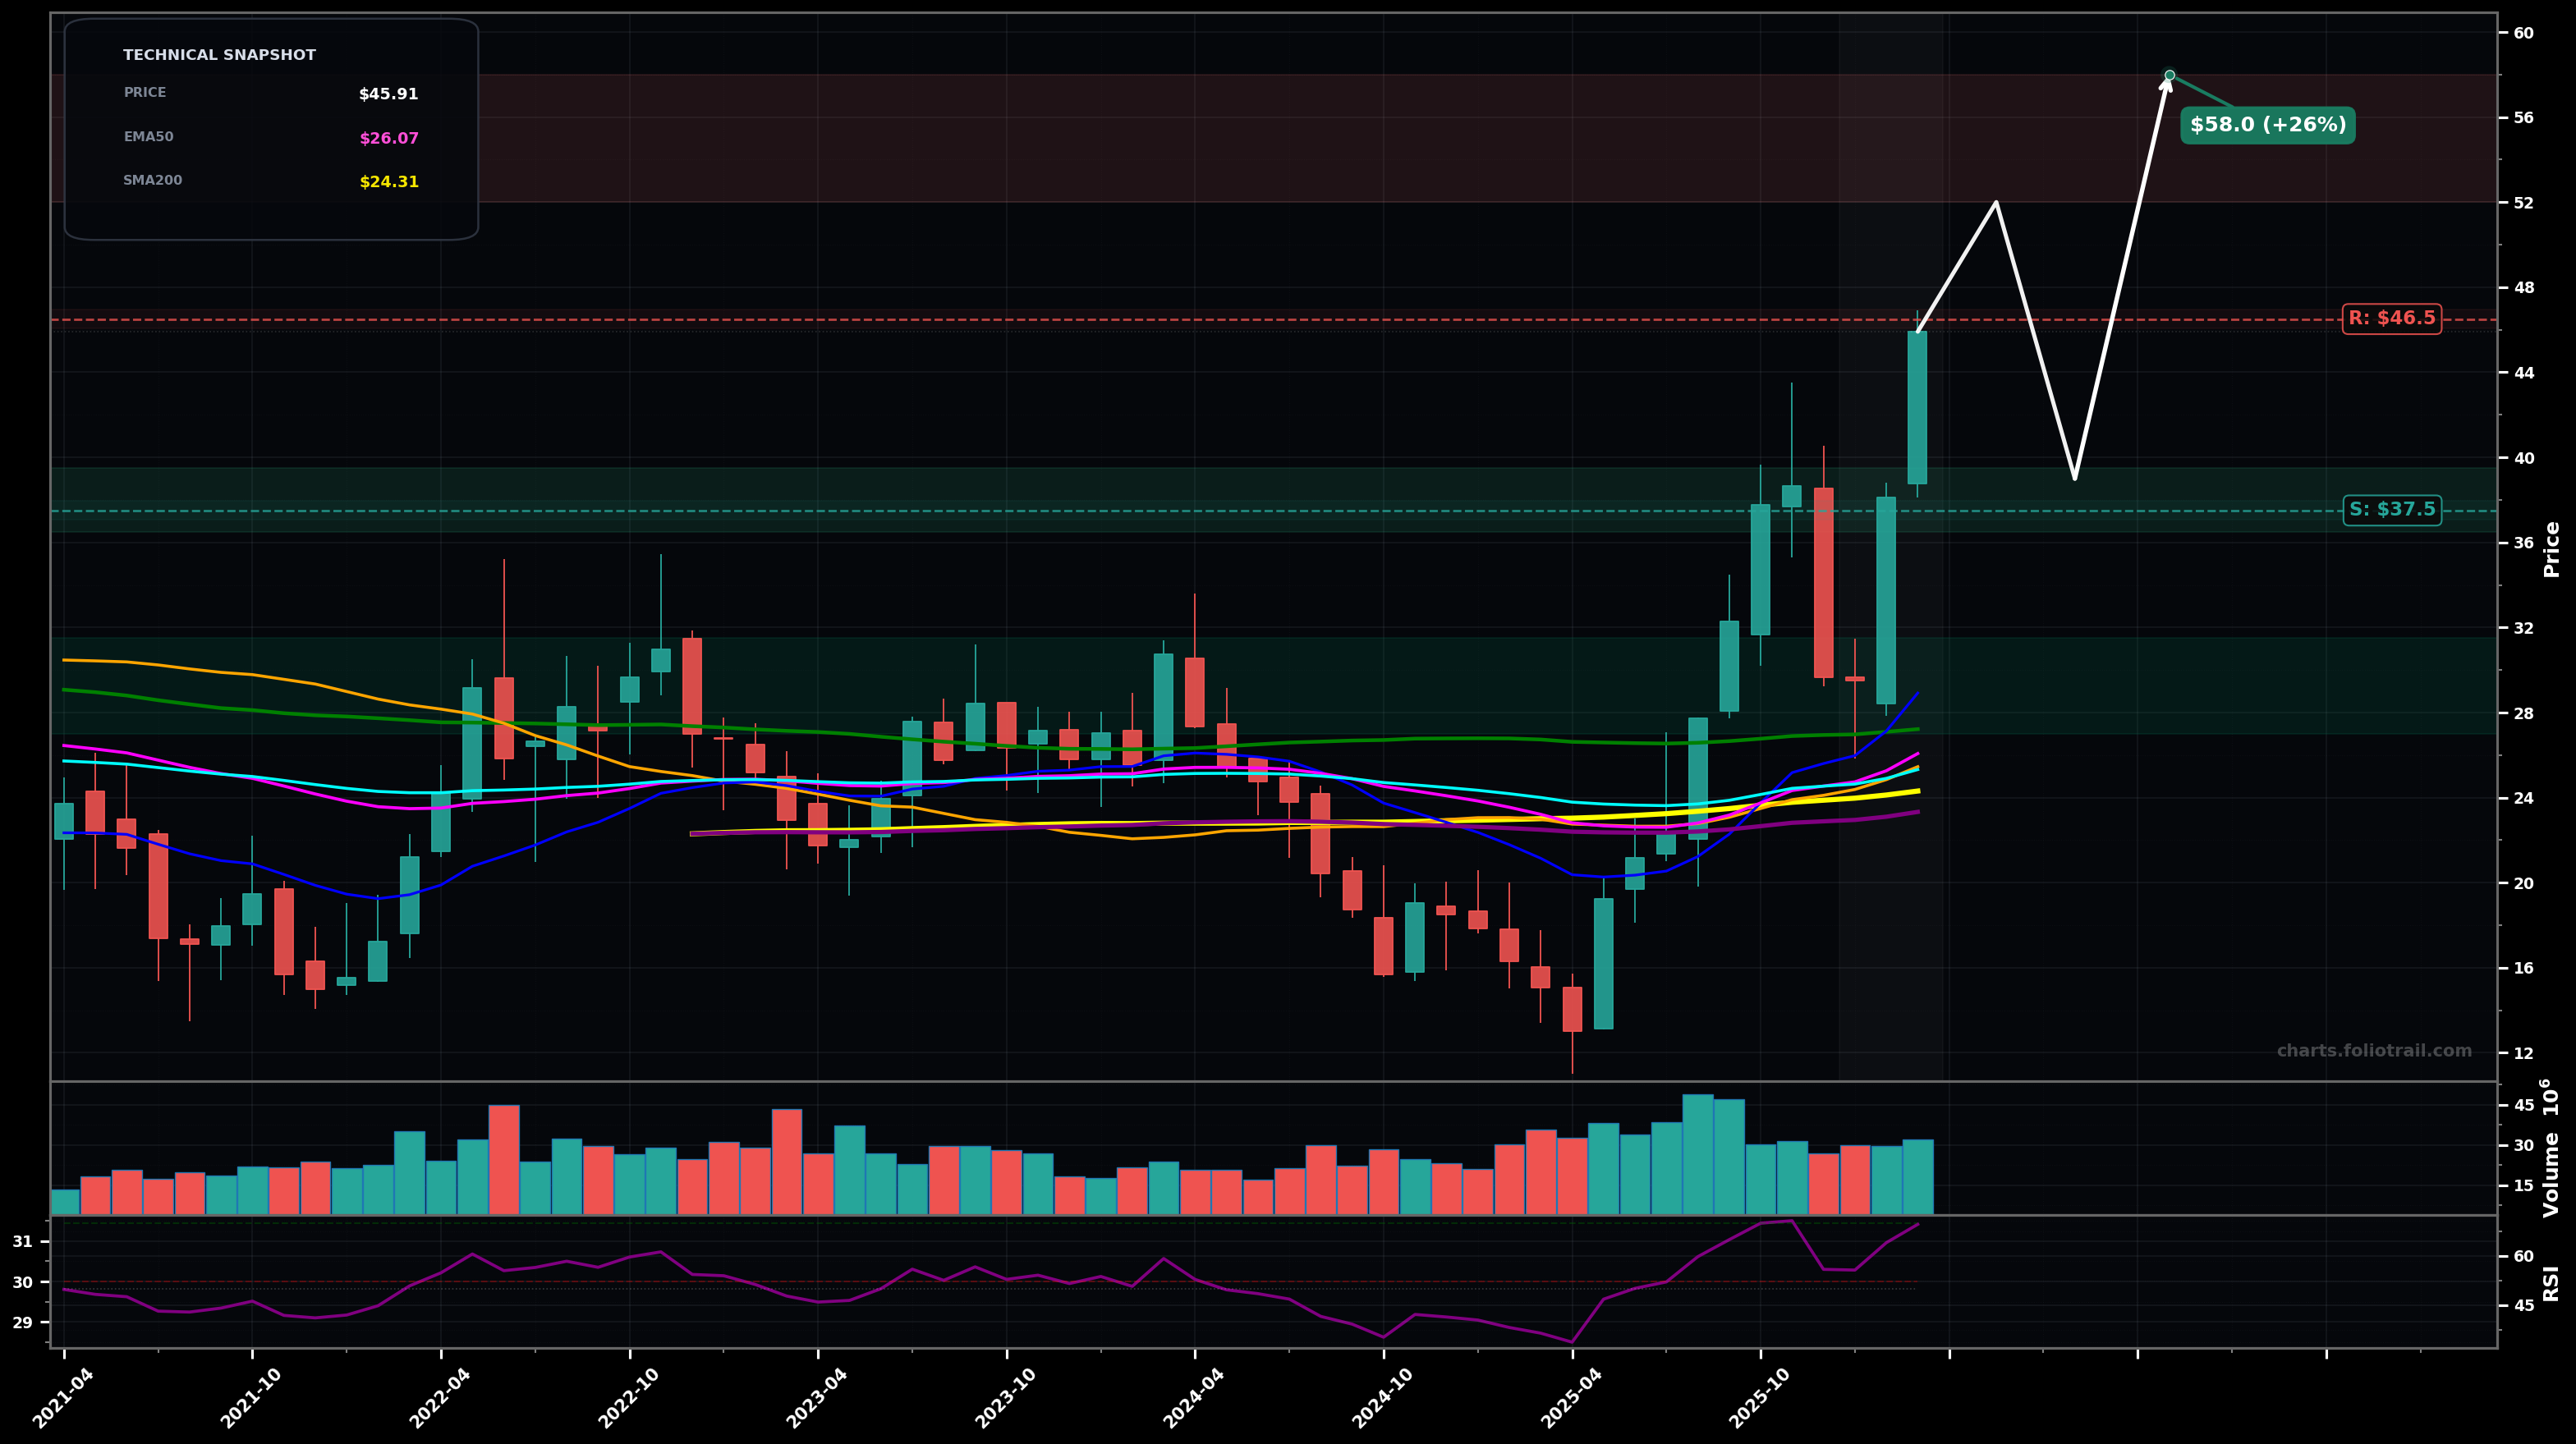
As of March 25, 2026, DK (Delek US Holdings Inc.) is in a parabolic state on the monthly chart, with a confidence level of 72%. Key support is at $37.5 and key resistance at $46.5. Monthly breakout acceleration: sharp impulsive rally from the 2025 swing low, clearing clustered MAs (SMA50/100/200 + EMA50/100/200) and printing a fresh HH near $46; RSI elevated (~69).
Bullish continuation but with a likely pullback/consolidation first: price digests the vertical move (wave 4-type pause), retests the breakout zone, then attempts a final push (wave 5) toward the next Fibonacci extension area.
Parabolic blow-off fails: momentum reverses into a deeper mean-reversion (ABC or larger wave 2), rotating back toward the prior base/MA cluster as sellers defend the new highs.
Monthly close above $46.50 with follow-through (next month holds above $46.50)
Monthly close back below $37.50 (loss of breakout momentum and prior impulse support)
Buy-the-dip framework: first add on impulse support/possible wave-4 retest (~$37-$39), add more on deeper Fibonacci/structure pullback (~$32-$35), and heavy add near the prior MA cluster + base top/mean reversion area (~$27-$31).
Trims aligned to likely wave-5/Fib extension zones above the prior cycle high: reduce into $52-$58, trim harder if price keeps extending ($60-$68), and consider full exit in a stretched blow-off region ($70-$80).
As of March 25, 2026, DK (Delek US Holdings Inc.) is in a parabolic state on the monthly chart with 72% confidence. Monthly breakout acceleration: sharp impulsive rally from the 2025 swing low, clearing clustered MAs (SMA50/100/200 + EMA50/100/200) and printing a fresh HH near $46; RSI elevated (~69).
On the monthly timeframe, DK has key support at $37.5 and key resistance at $46.5. The most likely scenario (bullish) targets $52.0 and $58.0, with a revert level at $39.0.
DK (Delek US Holdings Inc.) is currently classified as parabolic on the monthly chart, with 72% confidence. Confirmation requires: Monthly close above $46.50 with follow-through (next month holds above $46.50) This would be invalidated by: Monthly close back below $37.50 (loss of breakout momentum and prior impulse support)
The most likely scenario (bullish) targets $52.0 and $58.0, with a revert level at $39.0. The alternative scenario (bearish) targets $32.0 and $27.5.
Multi-layer AI agents analyse 200+ stocks across daily, weekly, and monthly timeframes — producing market state classifications, price scenarios with targets, and position entry/exit levels. Updated every trading day after market close. No paywall. No sign-up required.
Built by Foliotrail.
All content on this website — including charts, analysis, price targets, support/resistance levels, and position zones — is generated entirely by AI and provided for educational and informational purposes only.
This is not financial advice. NEXUSNOIR VENTURES SL (the operator of this website) is not a registered investment adviser or broker-dealer. You should not make investment decisions based solely on this information. Always do your own research and consult a qualified financial advisor.
By continuing, you acknowledge that you have read and agree to our full disclaimer & terms of use and privacy policy.