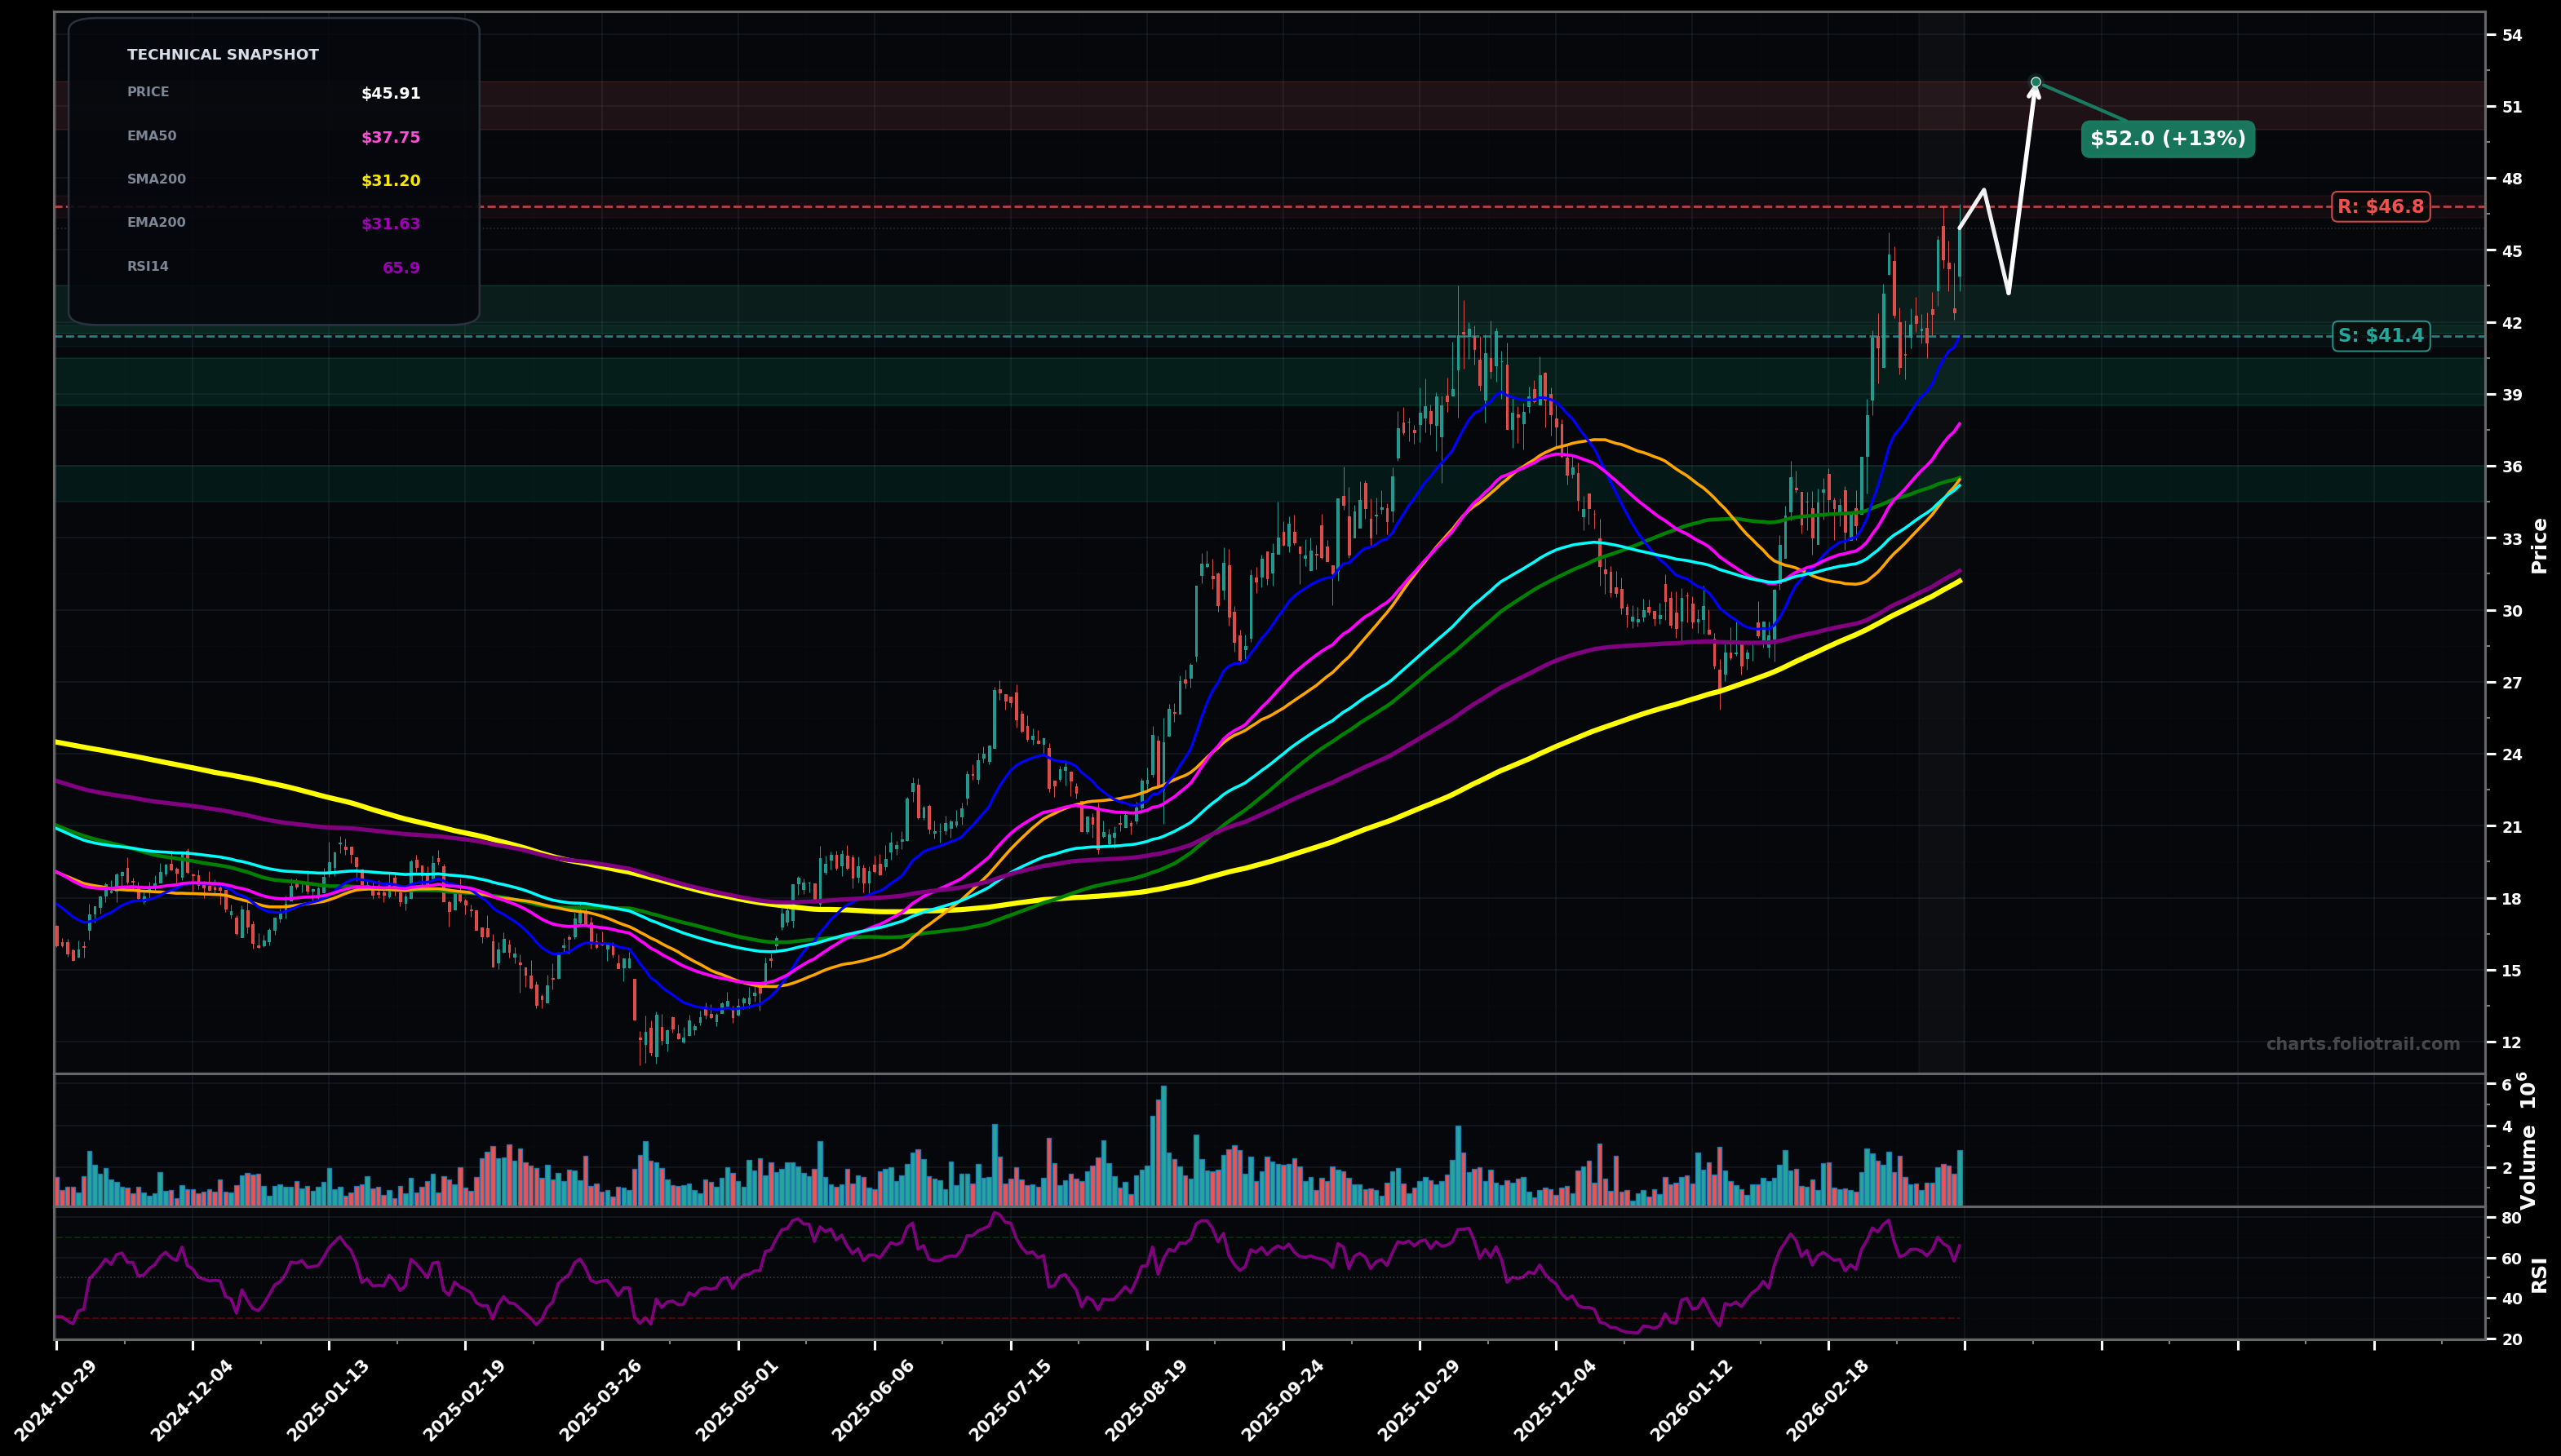
As of March 25, 2026, DK (Delek US Holdings Inc.) is in a uptrend state on the daily chart, with a confidence level of 74%. Key support is at $41.4 and key resistance at $46.8. Price at $45.91 pulled back after a sharp breakout run from the ~$34-$36 base; still holding well above rising EMA50/EMA100 with momentum (RSI ~66).
Bullish continuation: pullback stays above ~$41-$42 (prior breakout area), then price grinds back to highs and breaks out to a measured move extension.
Deeper correction: price fails to reclaim the highs and retraces toward the rising MA cluster (EMA50/SMA50 area) before attempting the next leg up.
2+ daily closes above $46.80 (reclaim/hold near prior highs) to resume impulse higher
Daily close below $41.40 (loss of the key breakout/short-term swing support area) shifts risk to a deeper pullback
Start near prior breakout/swing support (~$41-$43); add into EMA50 pullback (~$38-$40); heavy add at base + EMA100/SMA50-100 confluence (~$34.5-$36).
Trim into upside extensions after new ATH breakout (likely Fib/impulse extensions); larger trims on parabolic extensions well above EMA50/100; close into extreme multi-year stretch zones.
As of March 25, 2026, DK (Delek US Holdings Inc.) is in a uptrend state on the daily chart with 74% confidence. Price at $45.91 pulled back after a sharp breakout run from the ~$34-$36 base; still holding well above rising EMA50/EMA100 with momentum (RSI ~66).
On the daily timeframe, DK has key support at $41.4 and key resistance at $46.8. The most likely scenario (bullish) targets $47.5 and $52.0, with a revert level at $43.2.
DK (Delek US Holdings Inc.) is currently classified as uptrend on the daily chart, with 74% confidence. Confirmation requires: 2+ daily closes above $46.80 (reclaim/hold near prior highs) to resume impulse higher This would be invalidated by: Daily close below $41.40 (loss of the key breakout/short-term swing support area) shifts risk to a deeper pullback
The most likely scenario (bullish) targets $47.5 and $52.0, with a revert level at $43.2. The alternative scenario (bearish) targets $39.0 and $35.5.
Multi-layer AI agents analyse 200+ stocks across daily, weekly, and monthly timeframes — producing market state classifications, price scenarios with targets, and position entry/exit levels. Updated every trading day after market close. No paywall. No sign-up required.
Built by Foliotrail.
All content on this website — including charts, analysis, price targets, support/resistance levels, and position zones — is generated entirely by AI and provided for educational and informational purposes only.
This is not financial advice. NEXUSNOIR VENTURES SL (the operator of this website) is not a registered investment adviser or broker-dealer. You should not make investment decisions based solely on this information. Always do your own research and consult a qualified financial advisor.
By continuing, you acknowledge that you have read and agree to our full disclaimer & terms of use and privacy policy.