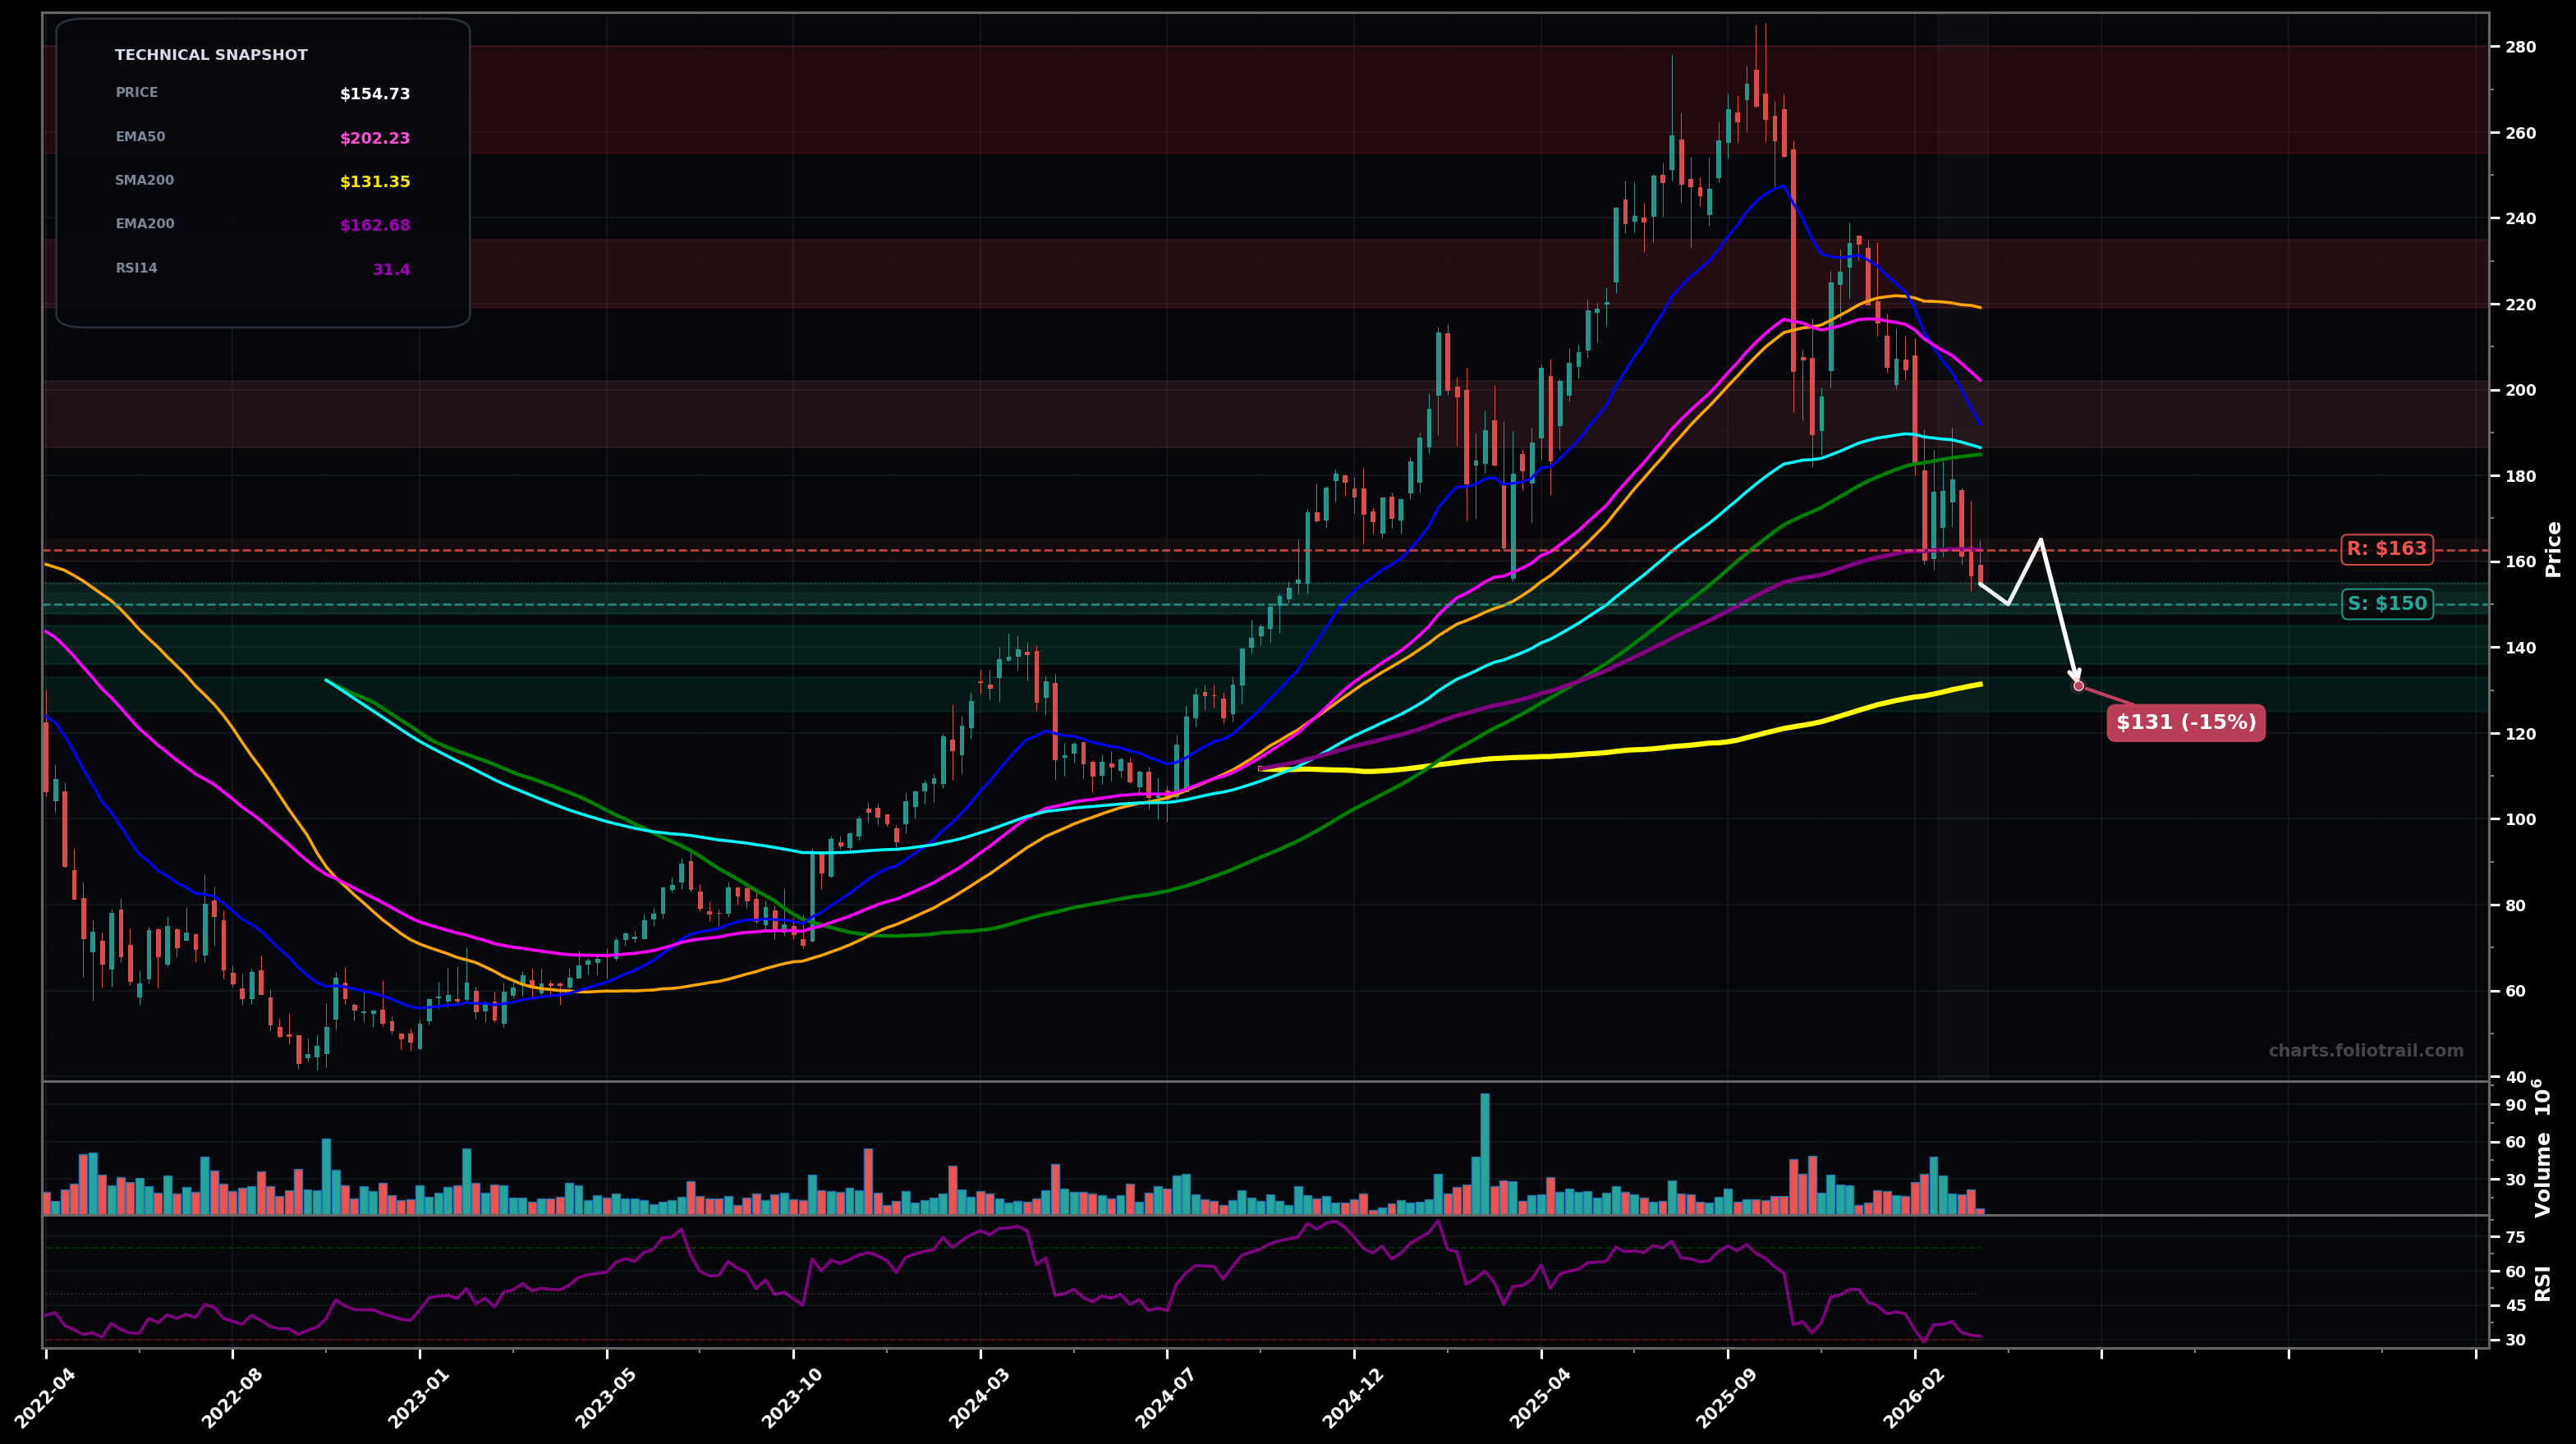
As of March 25, 2026, DASH (DoorDash, Inc.) is in a downtrend state on the weekly chart, with a confidence level of 74%. Key support is at $150 and key resistance at $163. Weekly selloff pushed price to ~$154.73, slicing below the EMA200 (~$162.68) and staying well under EMA50/EMA100; RSI14 ~31 suggests near-oversold but trend still pressured.
Bear-flag/weak bounce into the $162-$170 supply (EMA200 area), then continuation lower as sellers defend broken long-term MA; Elliott-wave read: likely still in a corrective/impulsive down leg (wave 3/ C) after the ~$280 top; Fib-wise, a common continuation path is toward the 0.618 retrace of the prior major advance, aligning near the low-$130s.
Capitulation-to-base attempt: hold $150 (or brief undercut to flush stops), then mean-revert back above EMA200 and build a range; Elliott-wave alternate: wave 5/C exhaustion with a developing A-B-C bounce; Fib bounce targets often tag prior breakdown zones near the EMA100/low-$180s.
Confirm downtrend continuation on a weekly close below $150.00
Invalidate (shift toward bottoming/breakout-reversal) on 2 weekly closes back above $186.50
Start near the $150 pivot (psych + recent swing support), add into the next demand pocket toward the ~$140s, heavy add near SMA200 (~$131) / likely Fib support zone if the down leg extends.
Trim into reclaim/mean-reversion levels (EMA100/EMA50 then SMA50/SMA100 confluence), and fully exit into the prior distribution/top supply zone near the ~$255-$280 peak area.
As of March 25, 2026, DASH (DoorDash, Inc.) is in a downtrend state on the weekly chart with 74% confidence. Weekly selloff pushed price to ~$154.73, slicing below the EMA200 (~$162.68) and staying well under EMA50/EMA100; RSI14 ~31 suggests near-oversold but trend still pressured.
On the weekly timeframe, DASH has key support at $150 and key resistance at $163. The most likely scenario (bearish) targets $150 and $131, with a revert level at $165.
DASH (DoorDash, Inc.) is currently classified as downtrend on the weekly chart, with 74% confidence. Confirmation requires: Confirm downtrend continuation on a weekly close below $150.00 This would be invalidated by: Invalidate (shift toward bottoming/breakout-reversal) on 2 weekly closes back above $186.50
The most likely scenario (bearish) targets $150 and $131, with a revert level at $165. The alternative scenario (bullish) targets $163 and $186.
Multi-layer AI agents analyse 200+ stocks across daily, weekly, and monthly timeframes — producing market state classifications, price scenarios with targets, and position entry/exit levels. Updated every trading day after market close. No paywall. No sign-up required.
Built by Foliotrail.
All content on this website — including charts, analysis, price targets, support/resistance levels, and position zones — is generated entirely by AI and provided for educational and informational purposes only.
This is not financial advice. NEXUSNOIR VENTURES SL (the operator of this website) is not a registered investment adviser or broker-dealer. You should not make investment decisions based solely on this information. Always do your own research and consult a qualified financial advisor.
By continuing, you acknowledge that you have read and agree to our full disclaimer & terms of use and privacy policy.