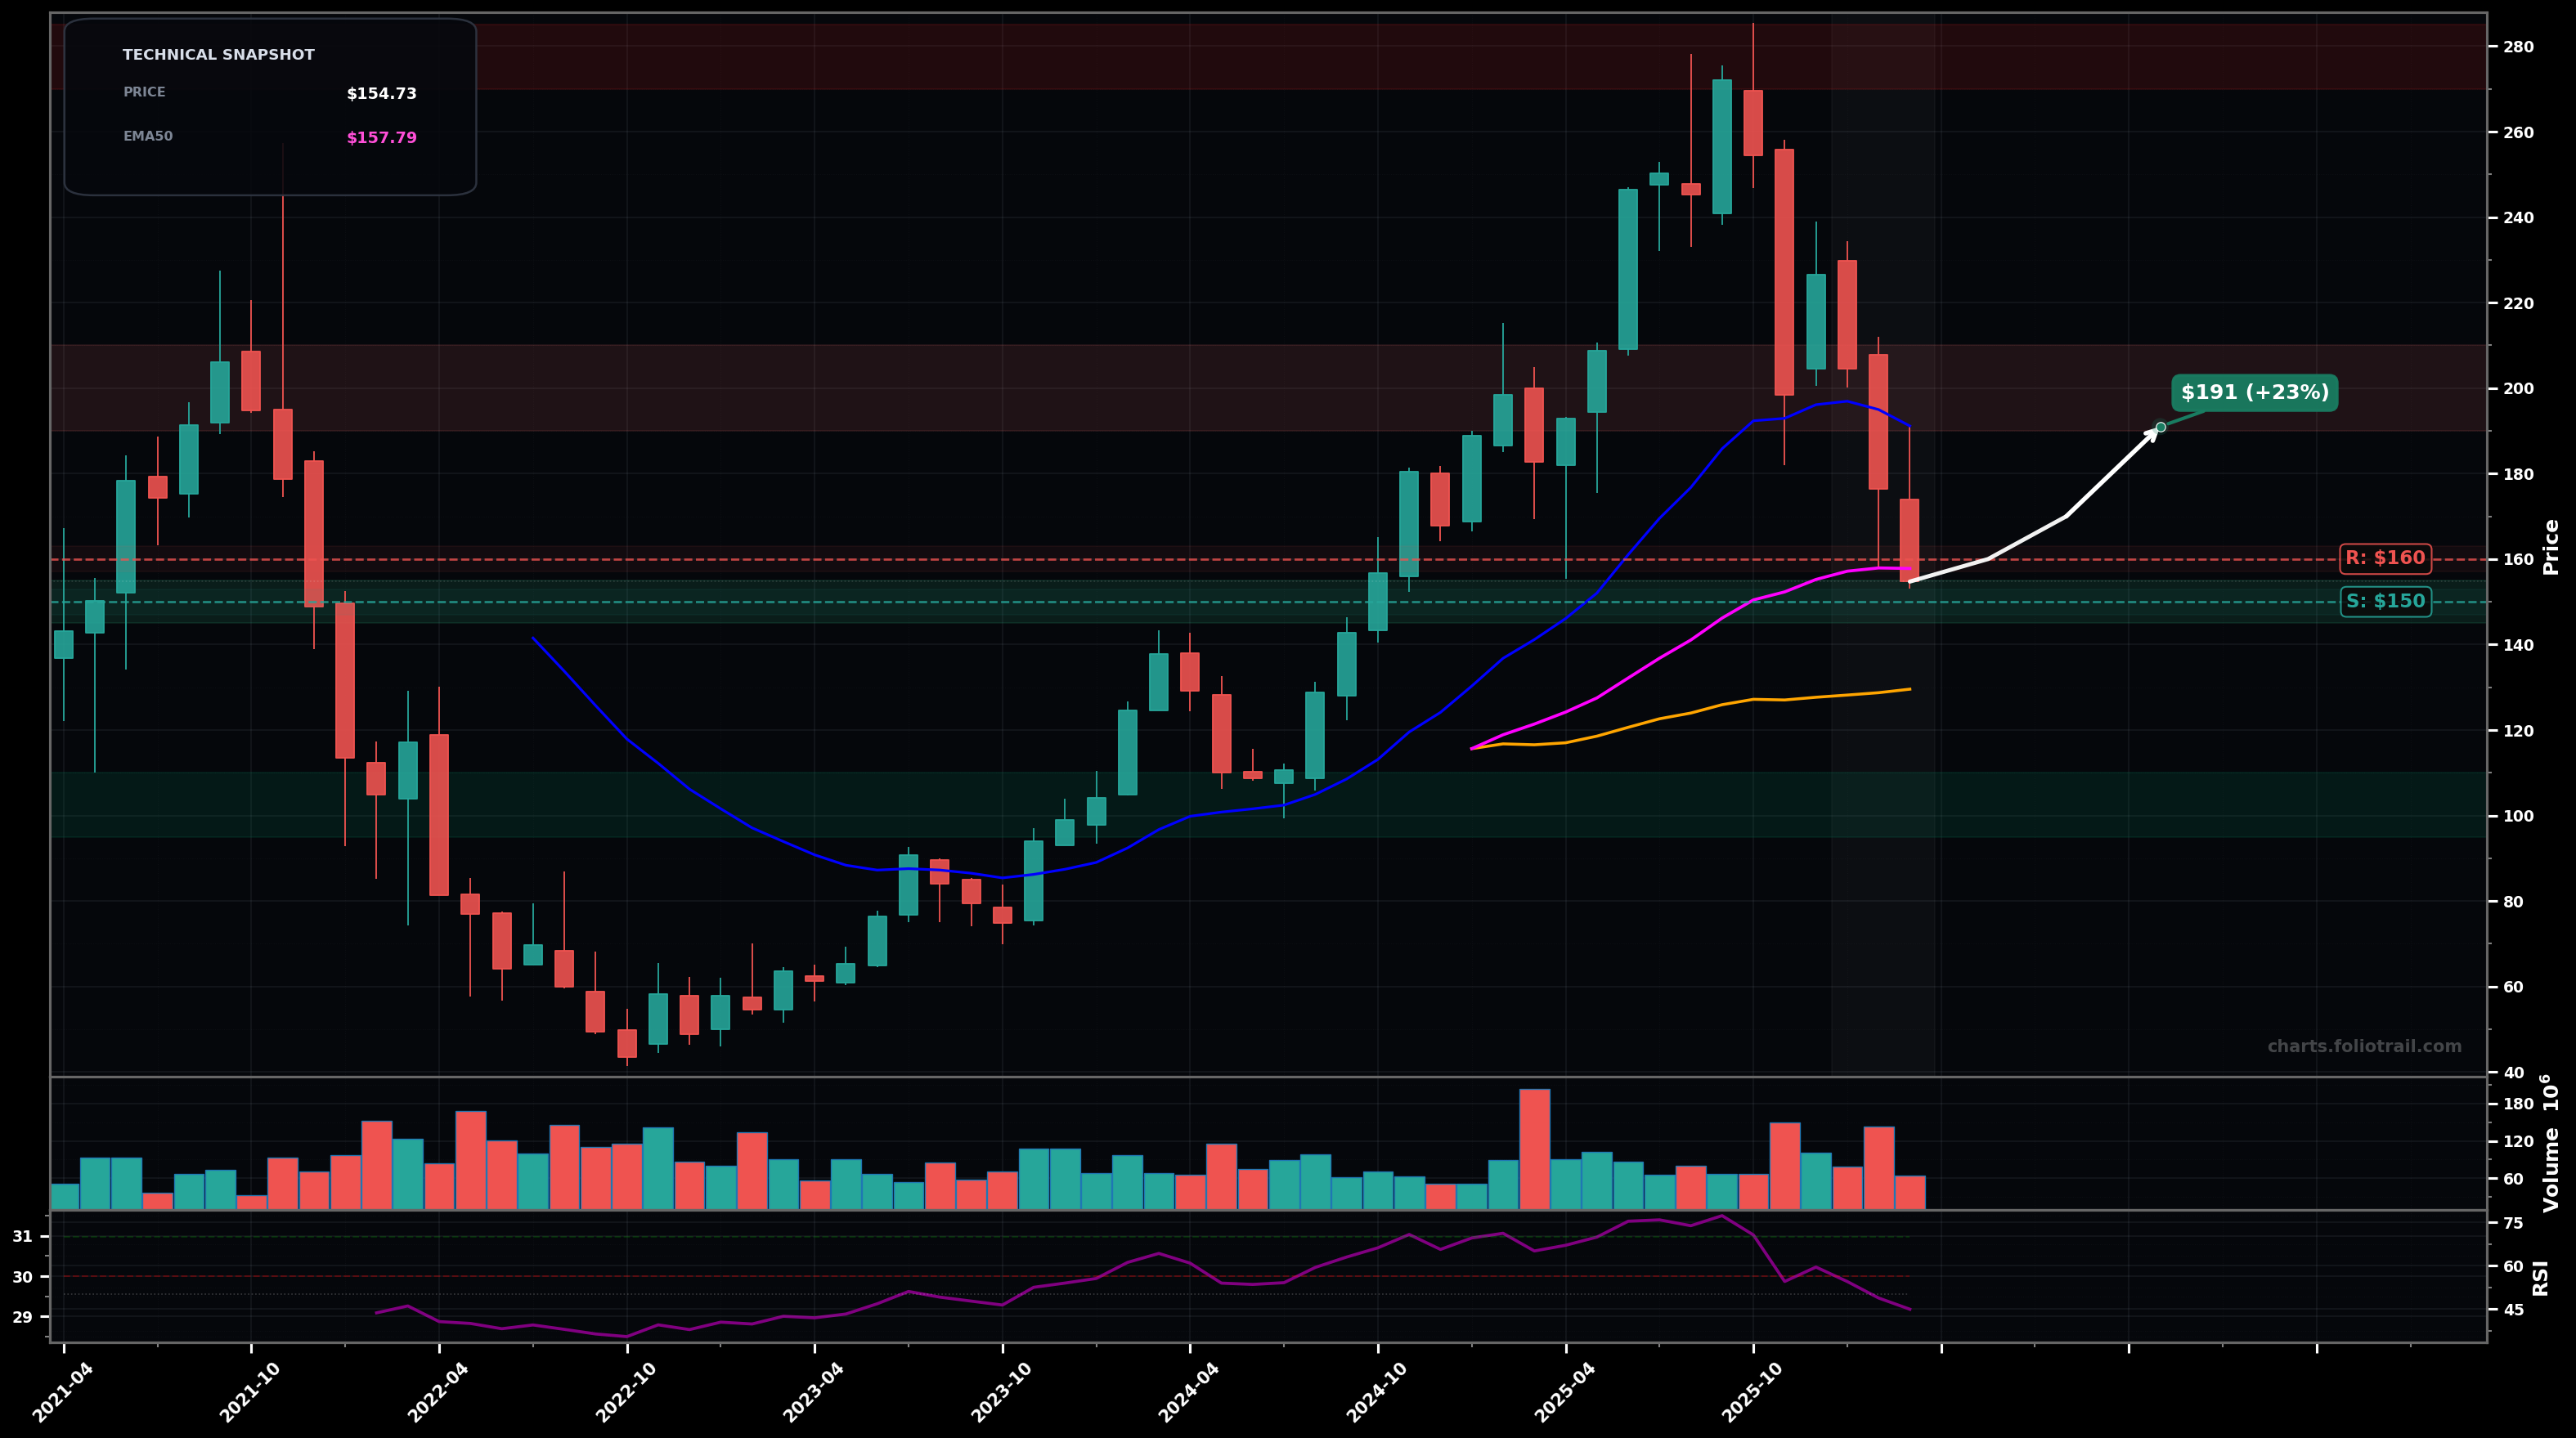
As of March 25, 2026, DASH (DoorDash, Inc.) is in a downtrend state on the monthly chart, with a confidence level of 62%. Key support is at $150 and key resistance at $160. Monthly pullback from the ~$270 peak; price at ~$154.73 is below EMA50 (~$157.79) and well below EMA20 (~$191.15) with RSI ~44.9, suggesting momentum loss after a strong advance.
Base/mean-reversion attempt: hold $150, chop/rebound to retest the EMA20 zone; if accepted, push toward prior breakdown supply.
Continuation leg down: lose $150 on a monthly close, triggering a deeper retracement into the prior consolidation and the rising SMA50 (~$129.6) area; potential overshoot to the next major demand zone.
Monthly close below $150 (break of the current pivot/support area) confirms continuation downside.
Two consecutive monthly closes back above $160 (reclaim/hold above EMA50 zone) would invalidate the near-term downtrend bias.
Start near current swing support ($150) if it holds; add at SMA50/structural base area (~$130); heavy add at deeper Fib retrace/previous demand shelf near ~$100 if capitulation prints.
Trim into the EMA20 reclaim/overhead supply (~$190-$210), more into the prior distribution zone (~$240-$260), and close near the prior peak/possible Wave-5 exhaustion area (~$270+).
As of March 25, 2026, DASH (DoorDash, Inc.) is in a downtrend state on the monthly chart with 62% confidence. Monthly pullback from the ~$270 peak; price at ~$154.73 is below EMA50 (~$157.79) and well below EMA20 (~$191.15) with RSI ~44.9, suggesting momentum loss after a strong advance.
On the monthly timeframe, DASH has key support at $150 and key resistance at $160. The most likely scenario (bullish) targets $160 and $191, with a revert level at $170.
DASH (DoorDash, Inc.) is currently classified as downtrend on the monthly chart, with 62% confidence. Confirmation requires: Monthly close below $150 (break of the current pivot/support area) confirms continuation downside. This would be invalidated by: Two consecutive monthly closes back above $160 (reclaim/hold above EMA50 zone) would invalidate the near-term downtrend bias.
The most likely scenario (bullish) targets $160 and $191, with a revert level at $170. The alternative scenario (bearish) targets $130 and $100.
Multi-layer AI agents analyse 200+ stocks across daily, weekly, and monthly timeframes — producing market state classifications, price scenarios with targets, and position entry/exit levels. Updated every trading day after market close. No paywall. No sign-up required.
Built by Foliotrail.
All content on this website — including charts, analysis, price targets, support/resistance levels, and position zones — is generated entirely by AI and provided for educational and informational purposes only.
This is not financial advice. NEXUSNOIR VENTURES SL (the operator of this website) is not a registered investment adviser or broker-dealer. You should not make investment decisions based solely on this information. Always do your own research and consult a qualified financial advisor.
By continuing, you acknowledge that you have read and agree to our full disclaimer & terms of use and privacy policy.