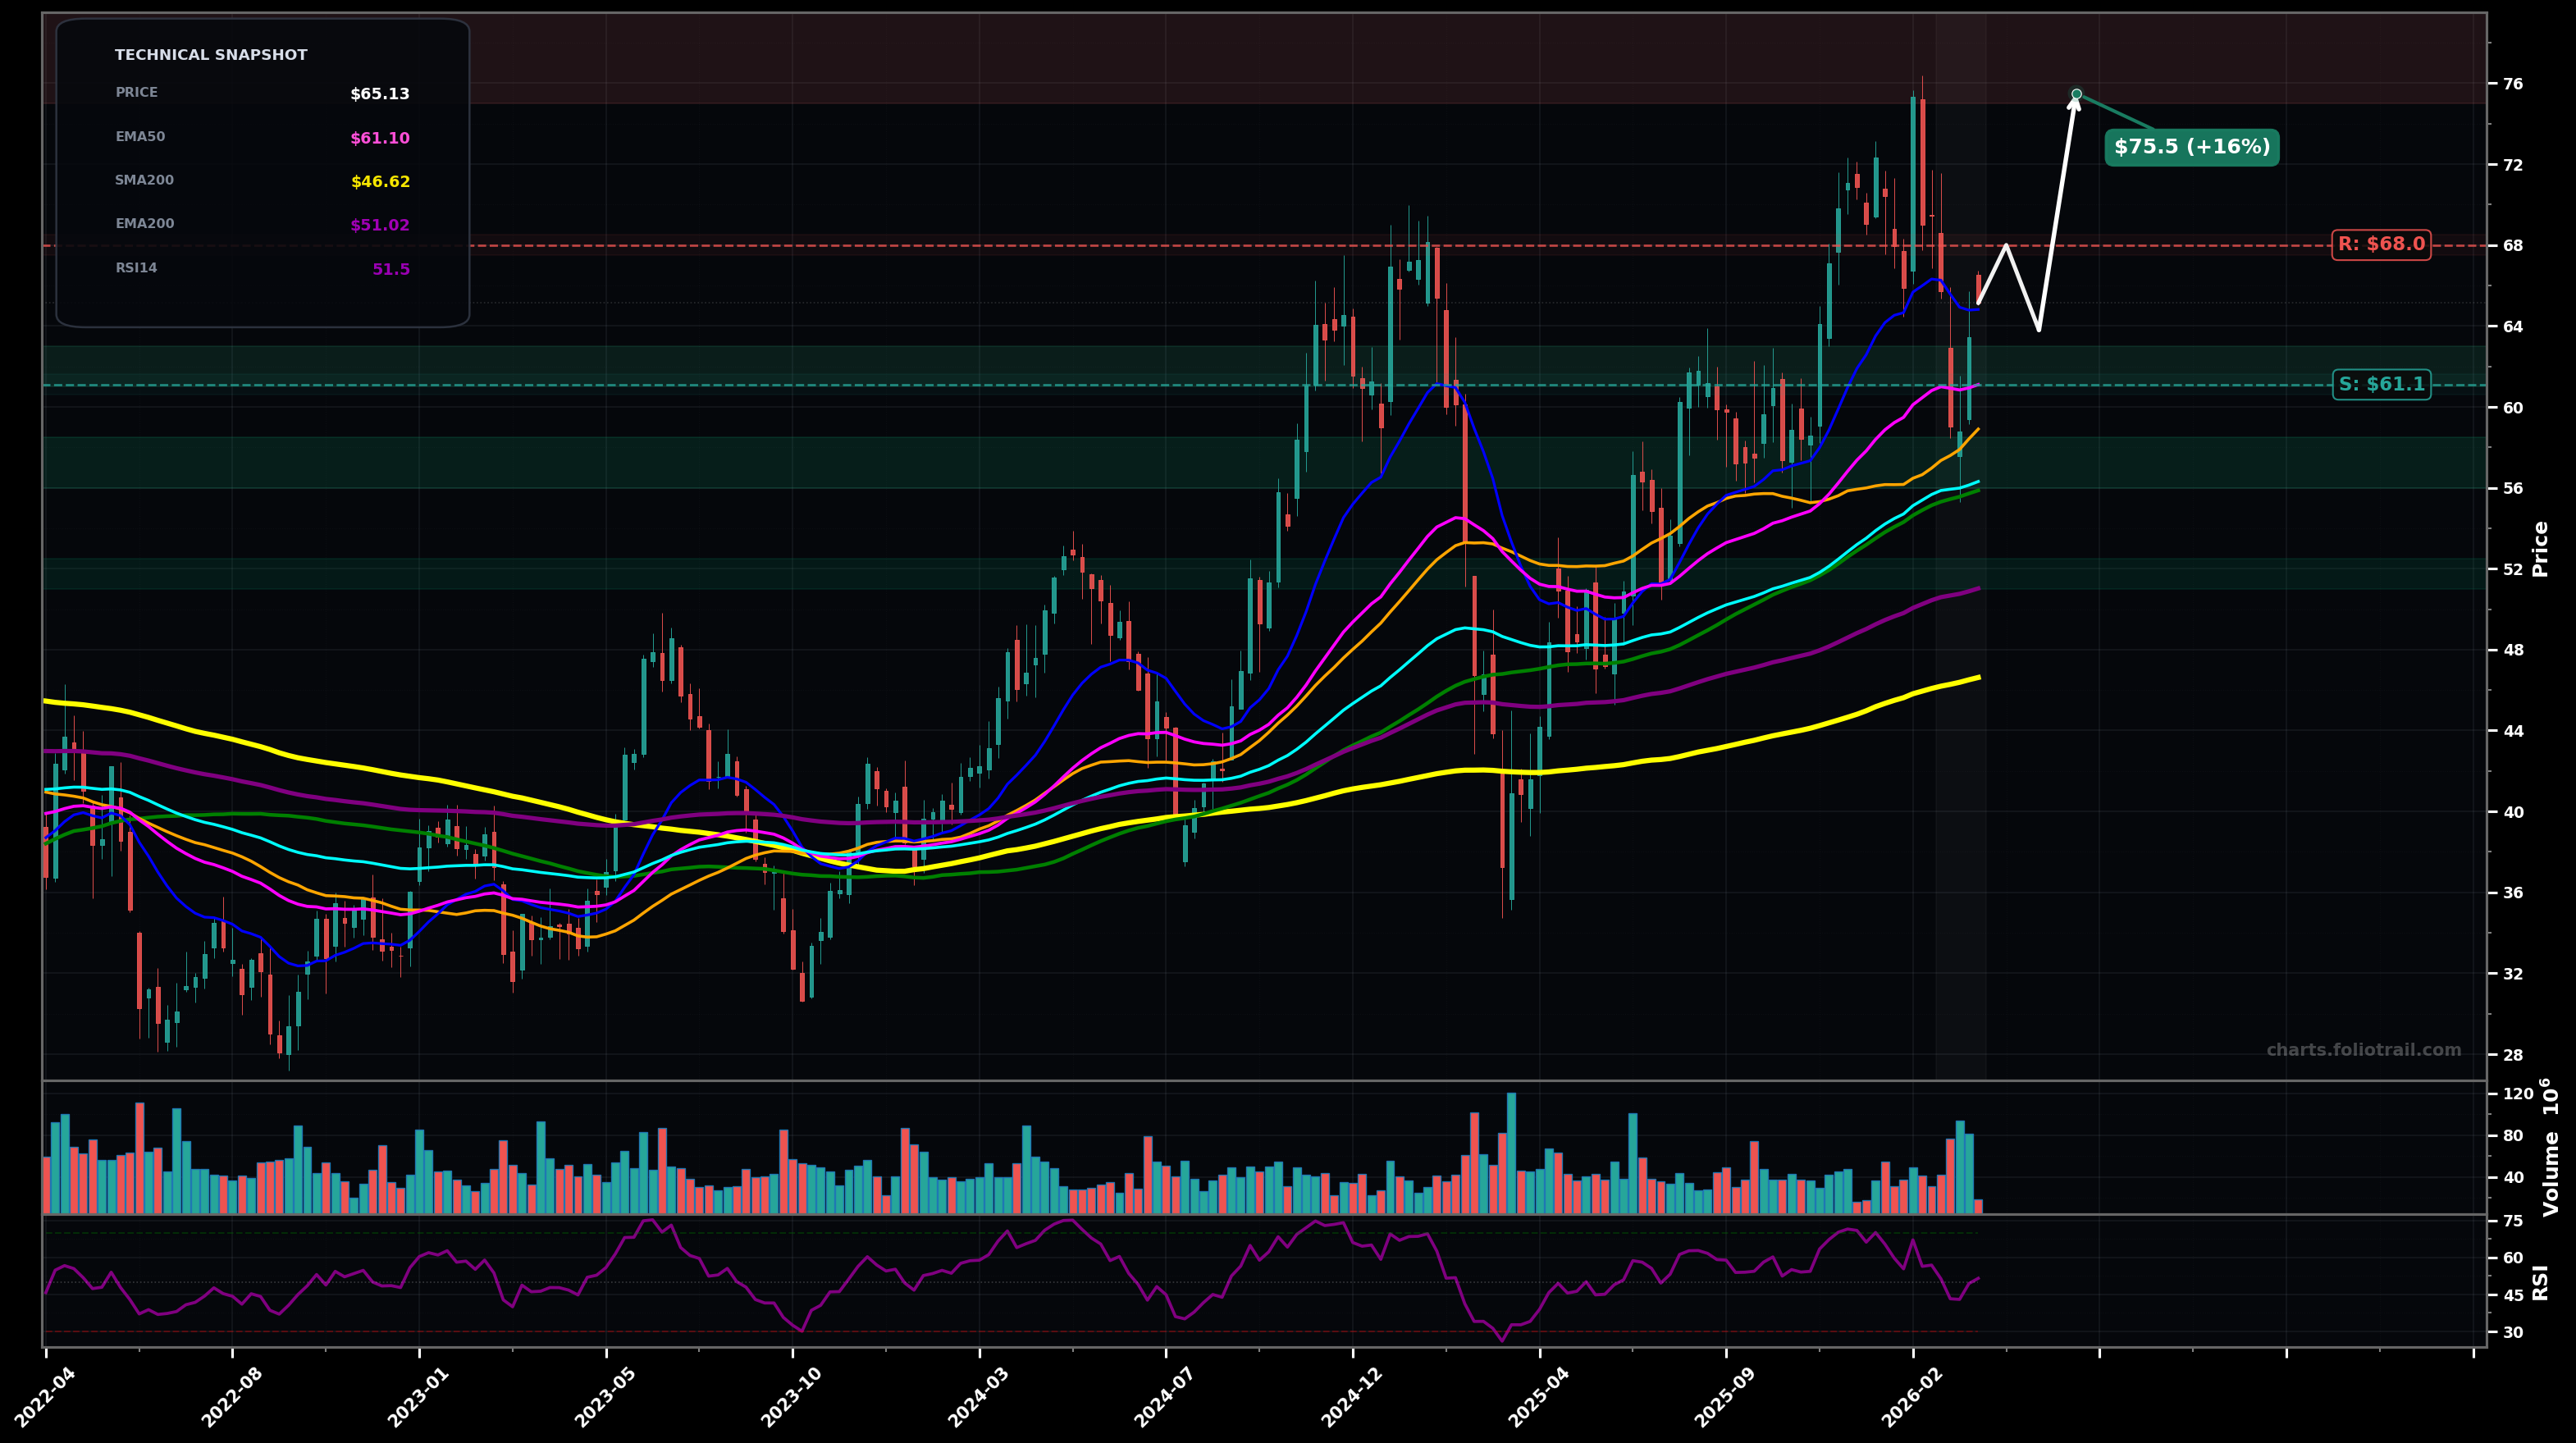
As of March 24, 2026, DAL (Delta Air Lines, Inc.) is in a uptrend state on the weekly chart, with a confidence level of 63%. Key support is at $61.1 and key resistance at $68.0. Weekly pullback from the $75-$76 peak, holding above the fast MAs; price consolidating around $65 with RSI ~52.
Bullish continuation: pullback stays corrective (likely wave 4 / ABC), holds $61 area, then resumes uptrend toward prior highs; watch for a higher low and reclaim of $68 to trigger momentum.
Deeper correction: failure to reclaim $68 and a breakdown below EMA50 turns the move into a larger ABC; price mean-reverts into the EMA100/SMA100 zone before finding demand.
Weekly close above $68.00 followed by a higher high over $70.00
Weekly close below $61.00 (loss of EMA50) with follow-through toward $56.30
Buy-the-dip zones mapped to EMA50 first, then EMA100/SMA100 confluence, then EMA200 (~$51) as the deeper swing-low reference area if scenario_2 plays out.
Trim into extensions above the prior peak (~$75-$76) and likely fib/impulse extensions; fully exit only on multi-year stretch well above all MAs with euphoric/overextended weekly candles.
As of March 24, 2026, DAL (Delta Air Lines, Inc.) is in a uptrend state on the weekly chart with 63% confidence. Weekly pullback from the $75-$76 peak, holding above the fast MAs; price consolidating around $65 with RSI ~52.
On the weekly timeframe, DAL has key support at $61.1 and key resistance at $68.0. The most likely scenario (bullish) targets $68.0 and $75.5, with a revert level at $63.8.
DAL (Delta Air Lines, Inc.) is currently classified as uptrend on the weekly chart, with 63% confidence. Confirmation requires: Weekly close above $68.00 followed by a higher high over $70.00 This would be invalidated by: Weekly close below $61.00 (loss of EMA50) with follow-through toward $56.30
The most likely scenario (bullish) targets $68.0 and $75.5, with a revert level at $63.8. The alternative scenario (bearish) targets $56.3 and $51.0.
All content on this website — including charts, analysis, price targets, support/resistance levels, and position zones — is generated entirely by AI and provided for educational and informational purposes only.
This is not financial advice. NEXUSNOIR VENTURES SL (the operator of this website) is not a registered investment adviser or broker-dealer. You should not make investment decisions based solely on this information. Always do your own research and consult a qualified financial advisor.
By continuing, you acknowledge that you have read and agree to our full disclaimer & terms of use and privacy policy.