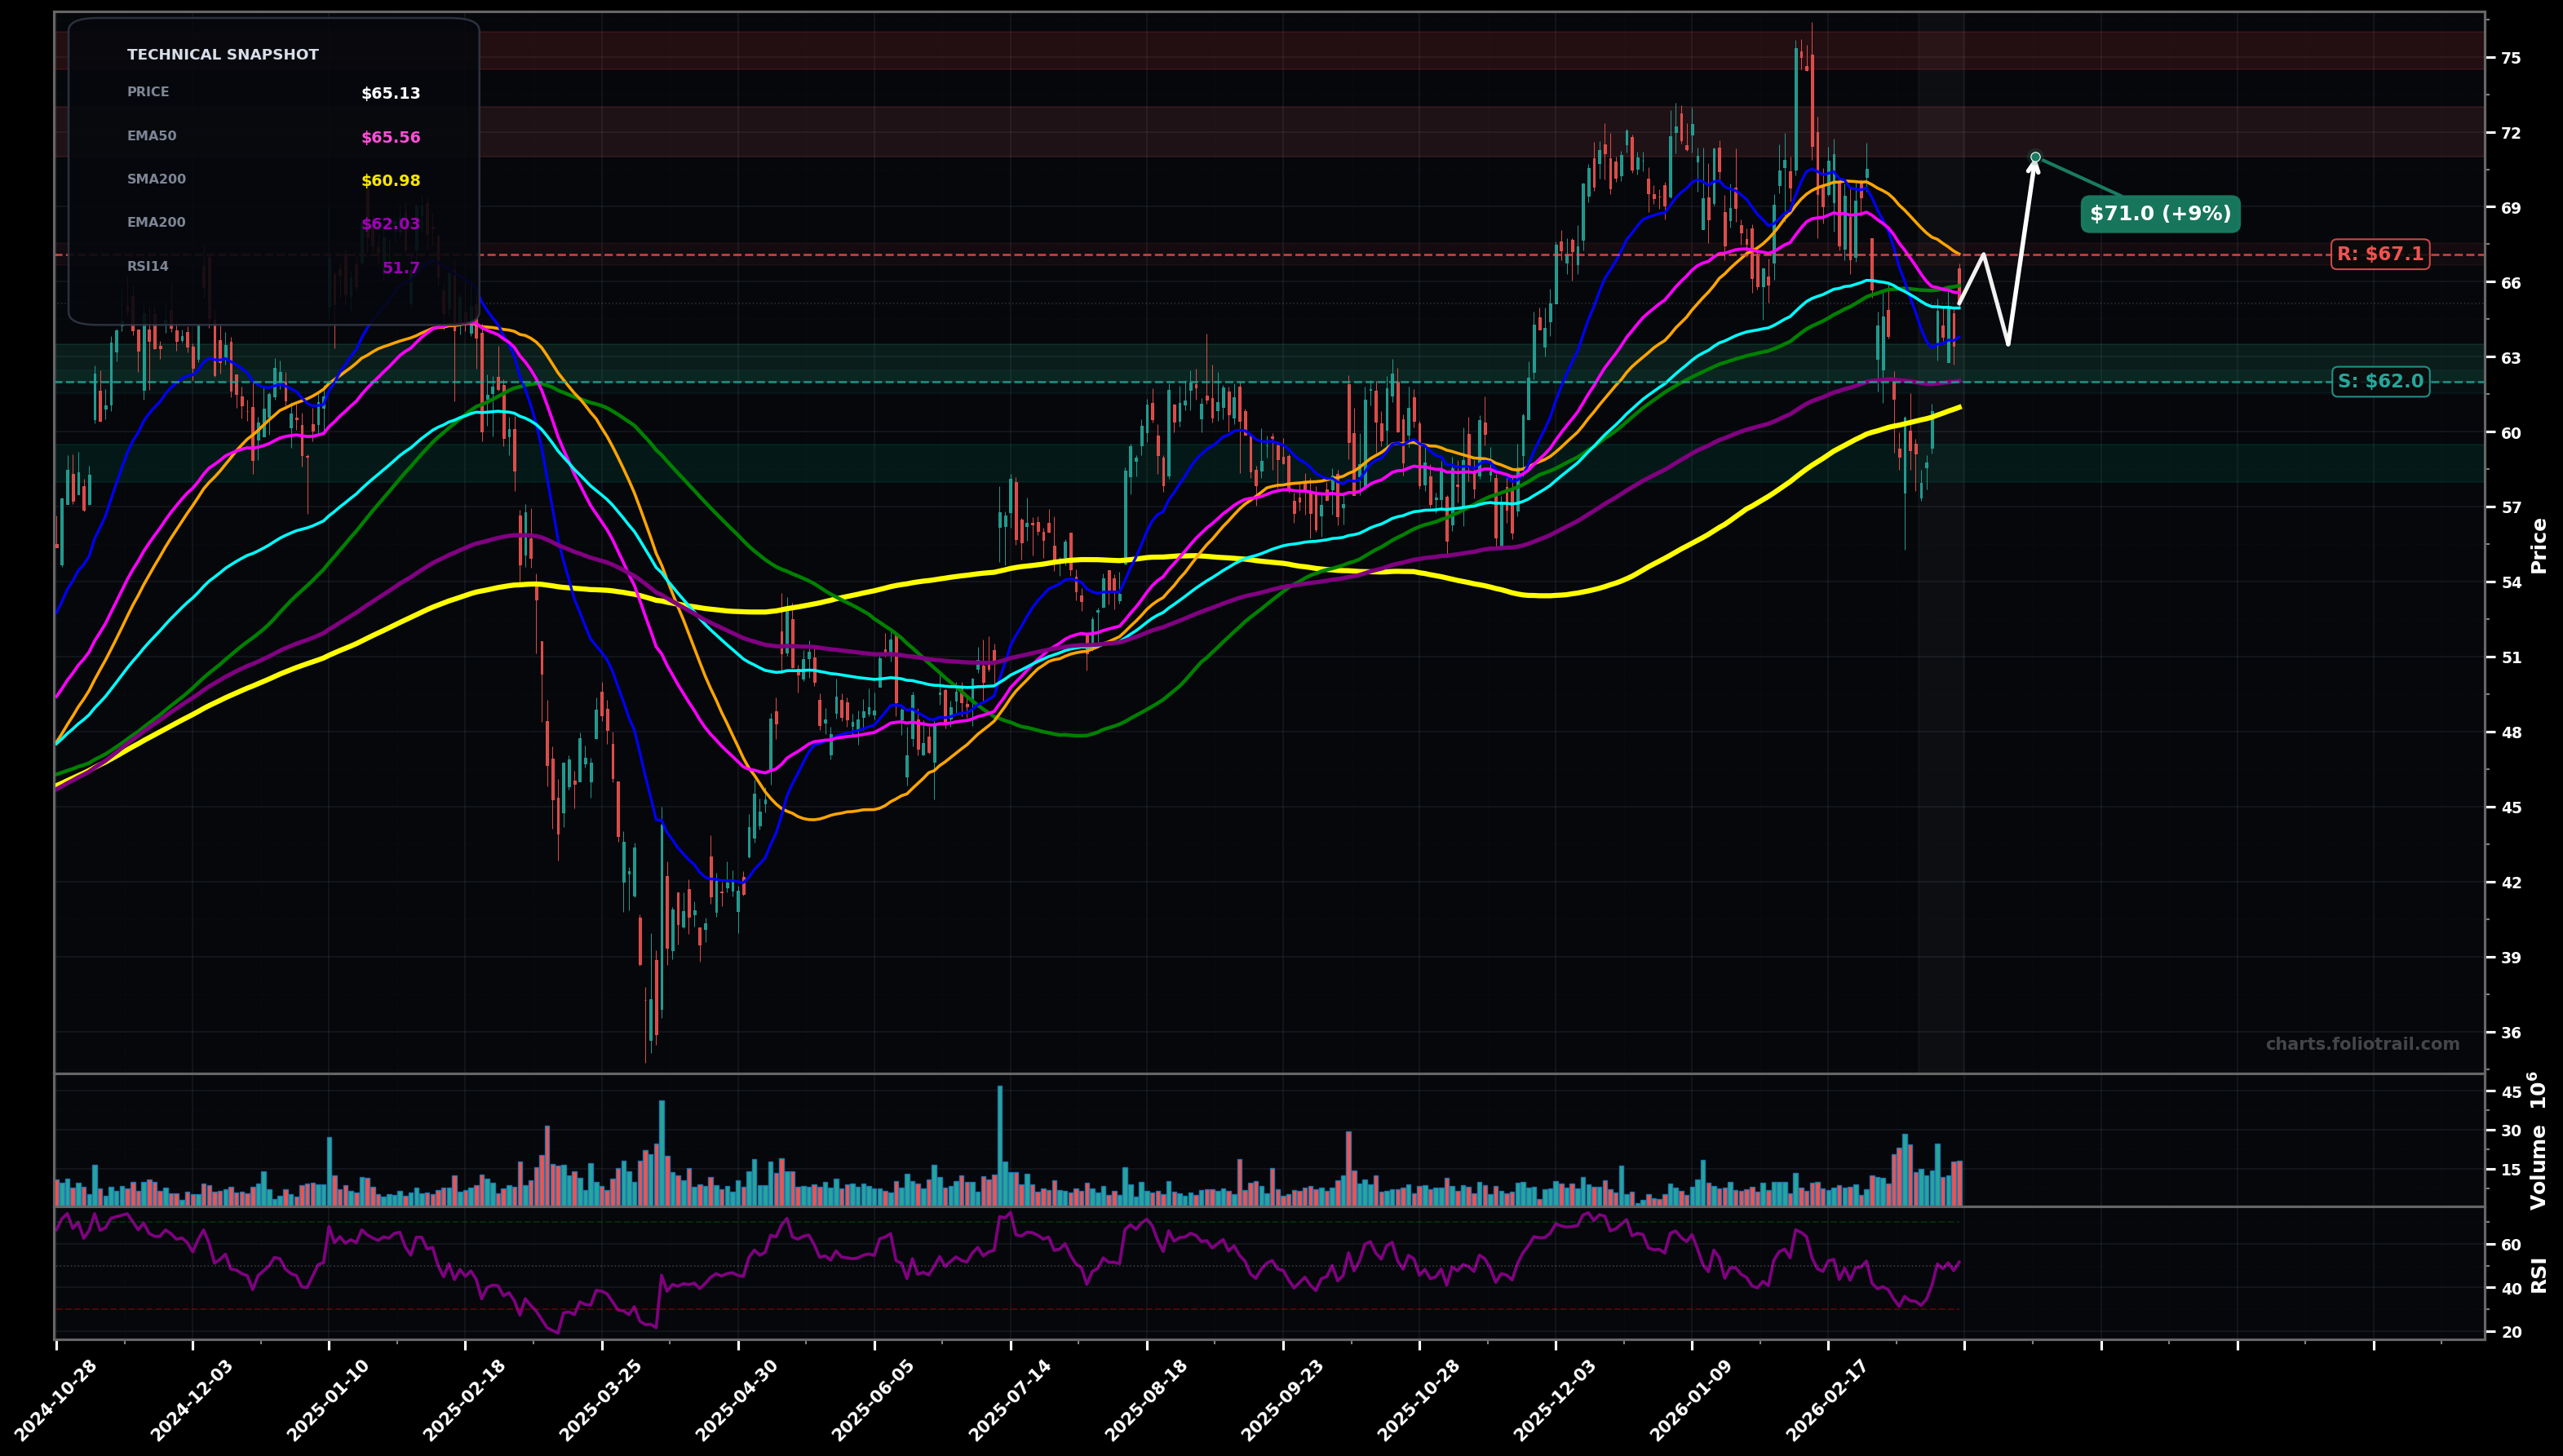
As of March 24, 2026, DAL (Delta Air Lines, Inc.) is in a bottoming attempt state on the daily chart, with a confidence level of 62%. Key support is at $62.0 and key resistance at $67.1. Sharp selloff from ~$75 into a ~$58 swing low, then bounce to ~$65; price still below the falling short-term MAs (SMA50/EMA50) with RSI ~52.
Range-to-reclaim: price holds above the $62 area (EMA200/near prior congestion), then grinds up and reclaims the $67 zone; if it sticks, momentum targets the next supply area near the late breakdown.
Failed bounce: rejection near $66-$67 leads to a retest of $62; if that fails, price revisits the $58 swing low and risks a deeper mean-reversion toward the $61-$60 band (SMA200).
2+ daily closes above $67.10 (SMA50) with EMA50 turning up
Daily close below $58.00 (recent swing low reference)
Start near EMA200 support/structure, add at SMA200 confluence, heavy add only on a full retest of the $58 swing-low reference (Elliott: possible Wave-2/Wave-B retest zone; Fib: ~50-61.8% retrace of the bounce).
Trim into overhead supply from the breakdown/previous peak zone (likely Wave-3/Wave-C extension if reclaim holds); close if price gets materially stretched above key MAs with prior highs fully exceeded.
As of March 24, 2026, DAL (Delta Air Lines, Inc.) is in a bottoming attempt state on the daily chart with 62% confidence. Sharp selloff from ~$75 into a ~$58 swing low, then bounce to ~$65; price still below the falling short-term MAs (SMA50/EMA50) with RSI ~52.
On the daily timeframe, DAL has key support at $62.0 and key resistance at $67.1. The most likely scenario (bullish) targets $67.1 and $71.0, with a revert level at $63.5.
DAL (Delta Air Lines, Inc.) is currently classified as bottoming attempt on the daily chart, with 62% confidence. Confirmation requires: 2+ daily closes above $67.10 (SMA50) with EMA50 turning up This would be invalidated by: Daily close below $58.00 (recent swing low reference)
The most likely scenario (bullish) targets $67.1 and $71.0, with a revert level at $63.5. The alternative scenario (bearish) targets $62.0 and $58.0.
All content on this website — including charts, analysis, price targets, support/resistance levels, and position zones — is generated entirely by AI and provided for educational and informational purposes only.
This is not financial advice. NEXUSNOIR VENTURES SL (the operator of this website) is not a registered investment adviser or broker-dealer. You should not make investment decisions based solely on this information. Always do your own research and consult a qualified financial advisor.
By continuing, you acknowledge that you have read and agree to our full disclaimer & terms of use and privacy policy.