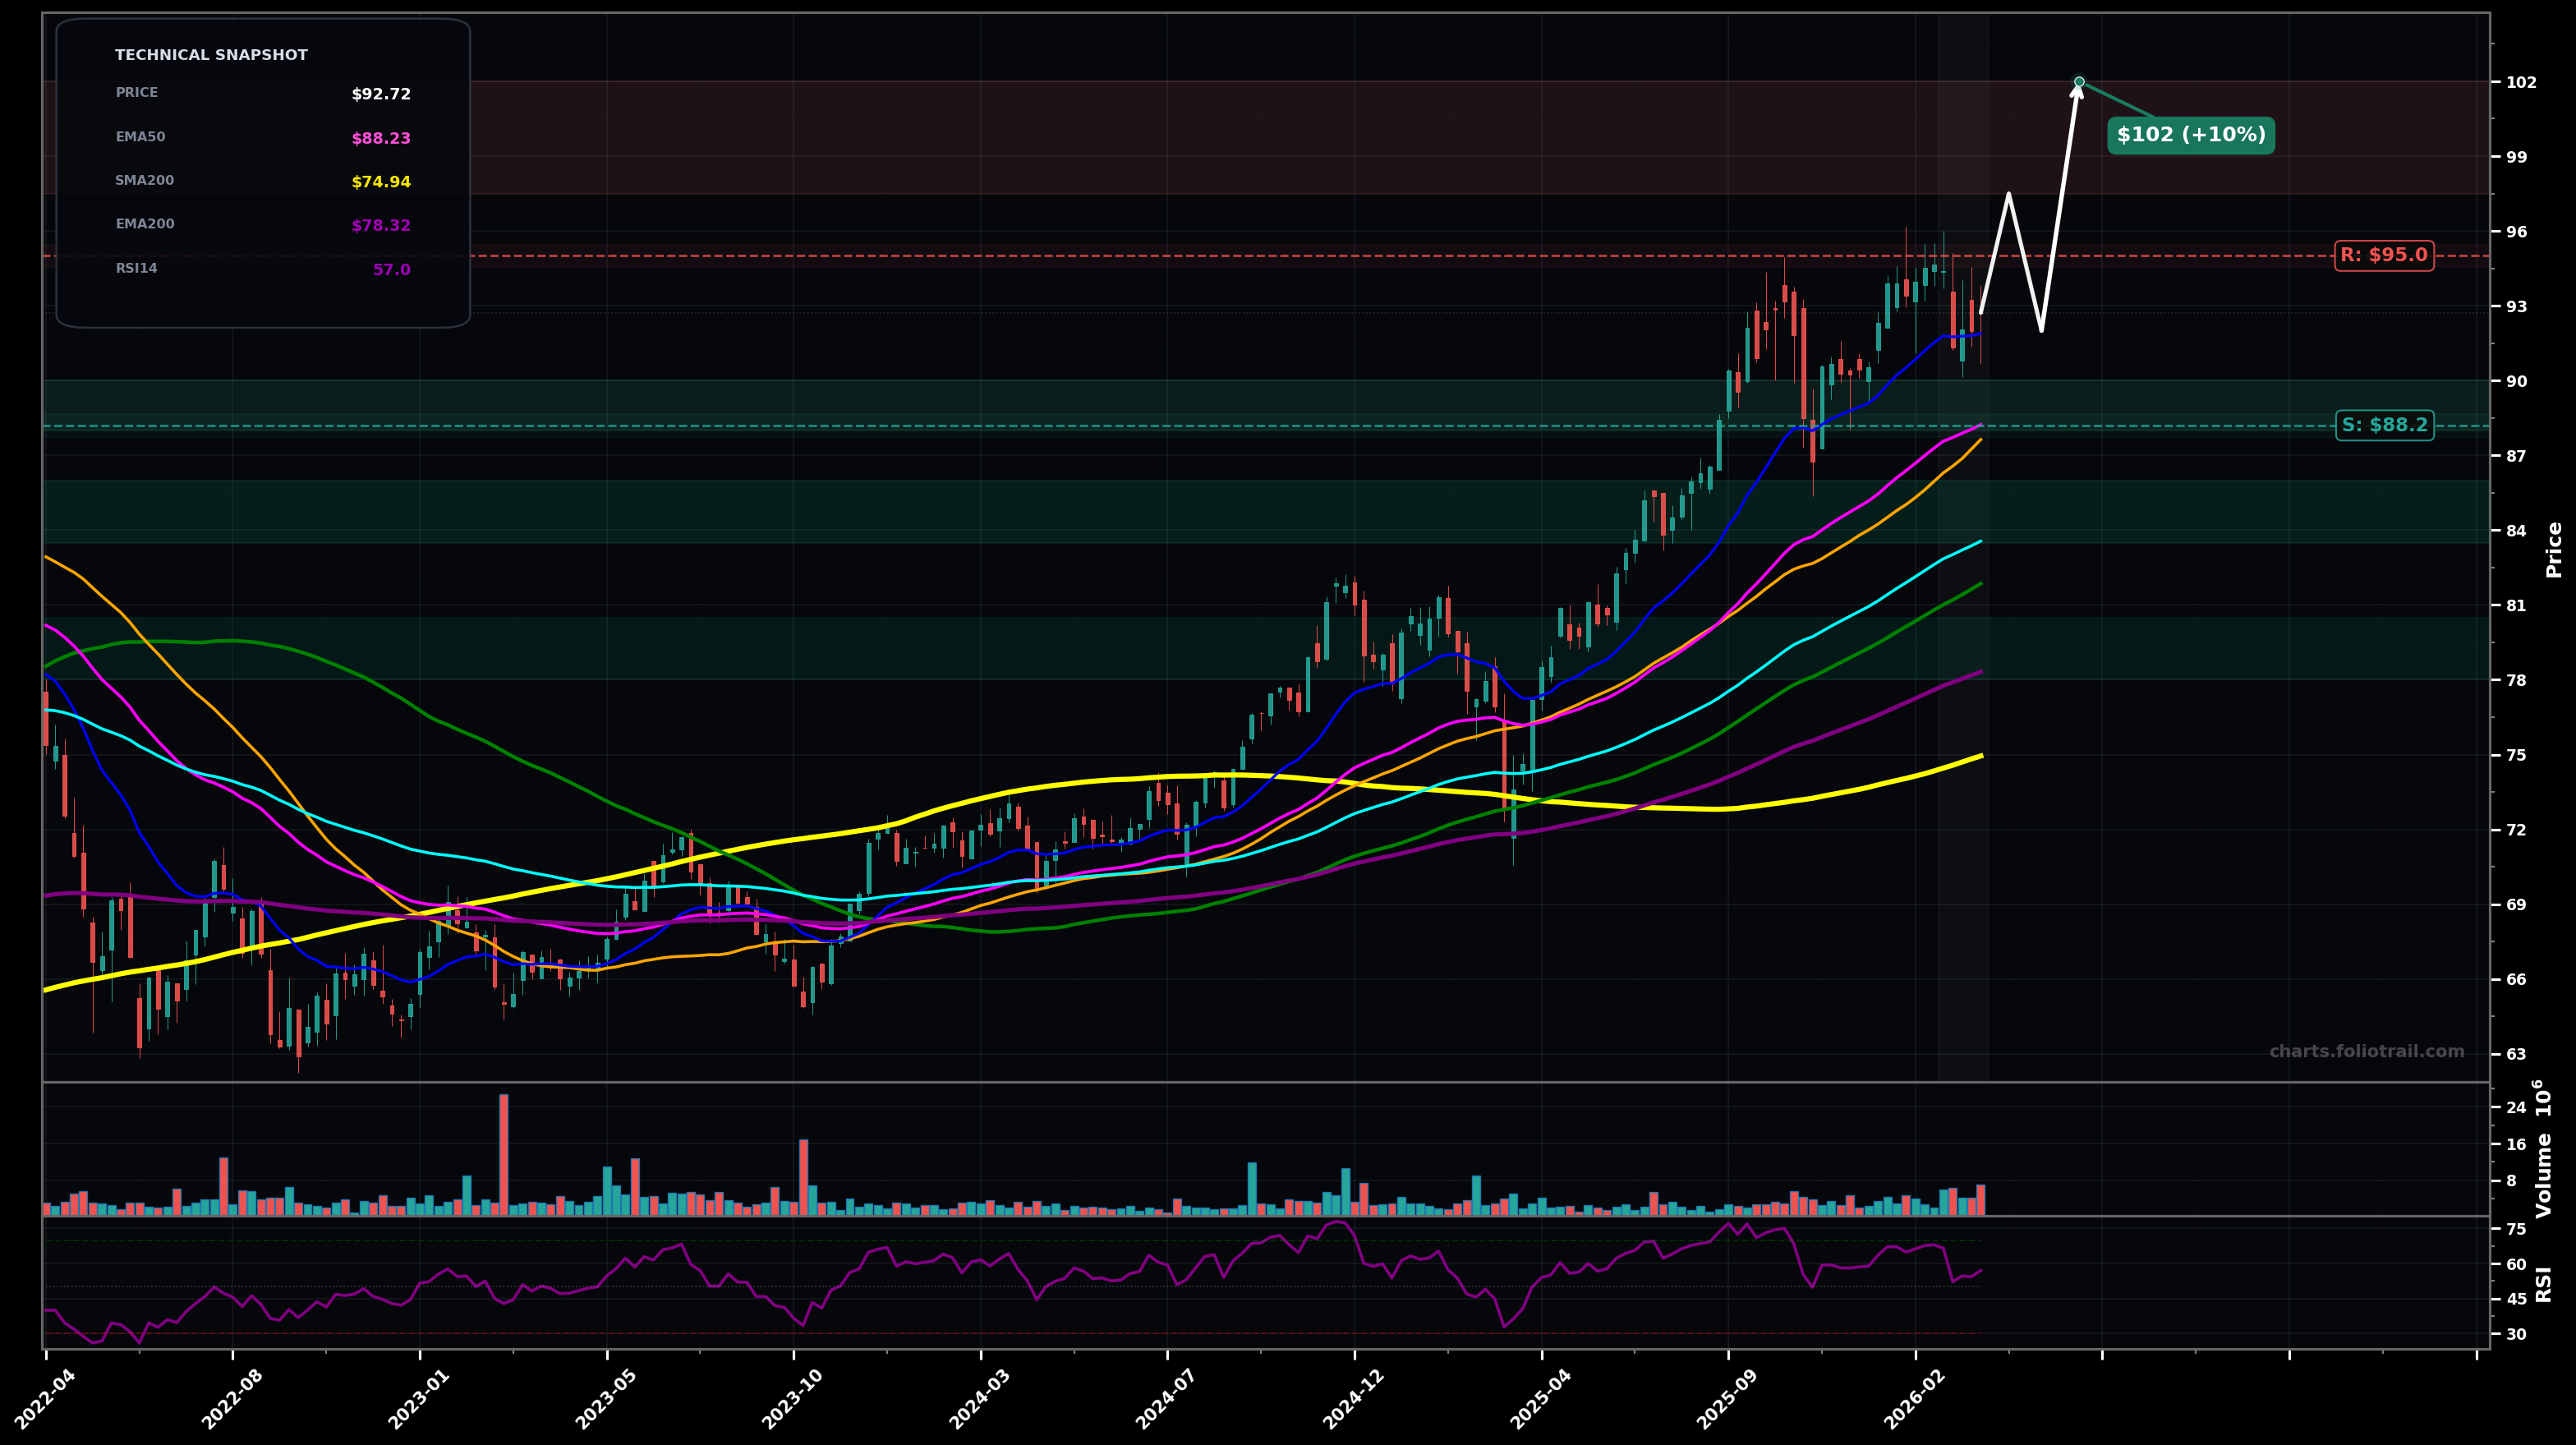
As of March 24, 2026, CWB (SPDR Bloomberg Convertible Securities ETF) is in a uptrend state on the weekly chart, with a confidence level of 72%. Key support is at $88.2 and key resistance at $95.0. Weekly uptrend paused; price ($92.72) consolidating just below recent highs (~$95) while holding above rising EMA50/EMA100 and above the short-term trendline cluster.
Bullish continuation: consolidation resolves upward; breakout above the ~$95 ceiling triggers trend resumption (likely Elliott Wave impulse continuation, with current pause acting like a Wave 4 / consolidation before a final push).
Deeper pullback but trend intact: price rejects near ~$95 and mean-reverts toward the rising EMA50 / prior breakout area; would still be consistent with a Wave 4-type retrace (common Fib zone ~0.382–0.5 of the prior upswing).
Weekly close above $95.00 followed by another close holding above $95.00
Weekly close below $88.00
Start near EMA50/prior swing support; add near EMA100 + prior base; heavy add near EMA200 where longer-term trend support typically attracts bids if the uptrend is still valid.
Trim into breakout extensions (likely Fib-based measured moves beyond the prior high); increase trimming as price becomes more extended above EMA50/EMA100 and sentiment/RSI risk rises; close if multi-year overextension develops far above major MAs.
As of March 24, 2026, CWB (SPDR Bloomberg Convertible Securities ETF) is in a uptrend state on the weekly chart with 72% confidence. Weekly uptrend paused; price ($92.72) consolidating just below recent highs (~$95) while holding above rising EMA50/EMA100 and above the short-term trendline cluster.
On the weekly timeframe, CWB has key support at $88.2 and key resistance at $95.0. The most likely scenario (bullish) targets $97.5 and $102, with a revert level at $92.0.
CWB (SPDR Bloomberg Convertible Securities ETF) is currently classified as uptrend on the weekly chart, with 72% confidence. Confirmation requires: Weekly close above $95.00 followed by another close holding above $95.00 This would be invalidated by: Weekly close below $88.00
The most likely scenario (bullish) targets $97.5 and $102, with a revert level at $92.0. The alternative scenario (bearish) targets $88.2 and $83.6.
All content on this website — including charts, analysis, price targets, support/resistance levels, and position zones — is generated entirely by AI and provided for educational and informational purposes only.
This is not financial advice. NEXUSNOIR VENTURES SL (the operator of this website) is not a registered investment adviser or broker-dealer. You should not make investment decisions based solely on this information. Always do your own research and consult a qualified financial advisor.
By continuing, you acknowledge that you have read and agree to our full disclaimer & terms of use and privacy policy.