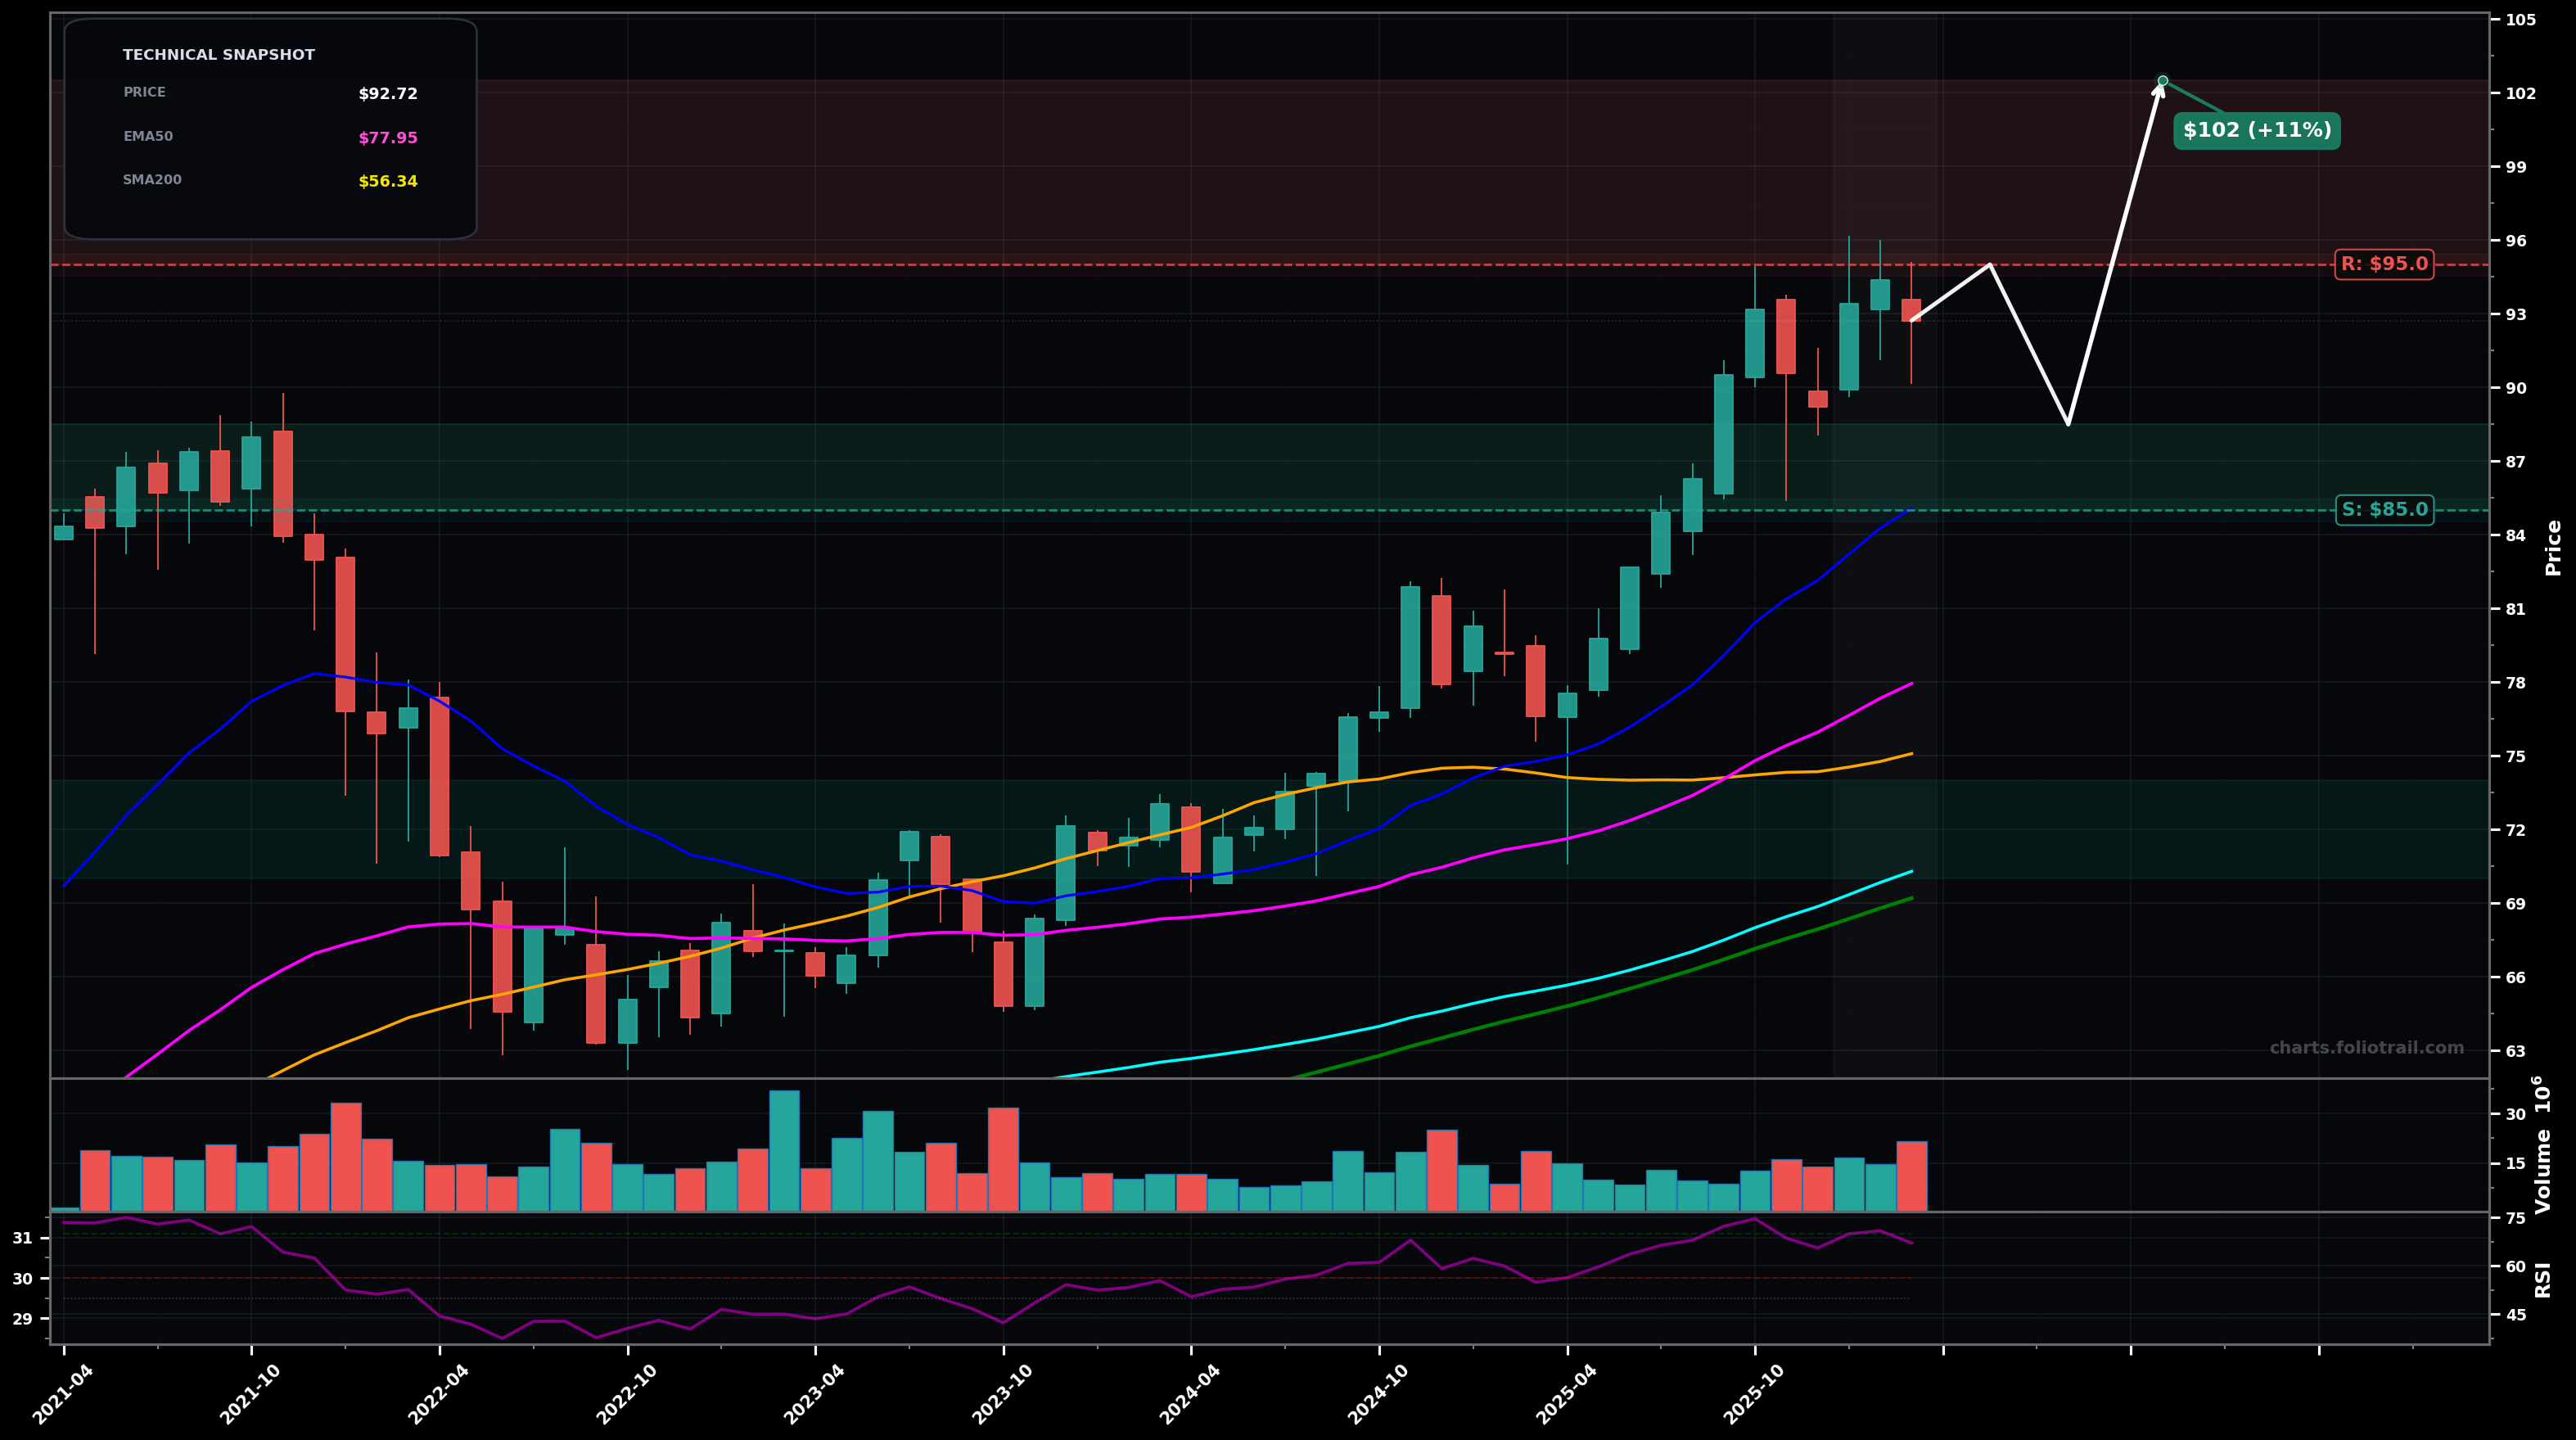
As of March 24, 2026, CWB (SPDR Bloomberg Convertible Securities ETF) is in a uptrend state on the monthly chart, with a confidence level of 76%. Key support is at $85.0 and key resistance at $95.0. Strong multi-month advance into the low-$90s; momentum still positive but candles show minor stalling near recent highs with RSI elevated.
Bullish continuation: pullback/flag holds above the prior breakout area (~$85) and resumes trend higher (Elliott view: wave 4 consolidation then wave 5 push).
Deeper monthly correction: rejection near $95 forms a LH on the monthly, price mean-reverts toward EMA50 (pink) before attempting a new base (Fib-style 38.2–50% retrace of the latest leg).
Monthly close above $95.00
Monthly close below $85.00
Start near prior breakout/structure support (~$85–$88.5); add on deeper retrace into EMA50/SMA50 zone (~$78–$82); heavy add near EMA100/SMA100 confluence and prior base support (~$70–$74).
Trim into resistance/extension as price stays far above EMA50 and RSI is elevated; heavier trims if it accelerates into a probable wave-5 exhaustion zone above ~$102.5; consider full exit only if it becomes materially stretched into ~$112+ with climactic monthly candles.
As of March 24, 2026, CWB (SPDR Bloomberg Convertible Securities ETF) is in a uptrend state on the monthly chart with 76% confidence. Strong multi-month advance into the low-$90s; momentum still positive but candles show minor stalling near recent highs with RSI elevated.
On the monthly timeframe, CWB has key support at $85.0 and key resistance at $95.0. The most likely scenario (bullish) targets $95.0 and $102, with a revert level at $88.5.
CWB (SPDR Bloomberg Convertible Securities ETF) is currently classified as uptrend on the monthly chart, with 76% confidence. Confirmation requires: Monthly close above $95.00 This would be invalidated by: Monthly close below $85.00
The most likely scenario (bullish) targets $95.0 and $102, with a revert level at $88.5. The alternative scenario (bearish) targets $85.0 and $78.0.
All content on this website — including charts, analysis, price targets, support/resistance levels, and position zones — is generated entirely by AI and provided for educational and informational purposes only.
This is not financial advice. NEXUSNOIR VENTURES SL (the operator of this website) is not a registered investment adviser or broker-dealer. You should not make investment decisions based solely on this information. Always do your own research and consult a qualified financial advisor.
By continuing, you acknowledge that you have read and agree to our full disclaimer & terms of use and privacy policy.