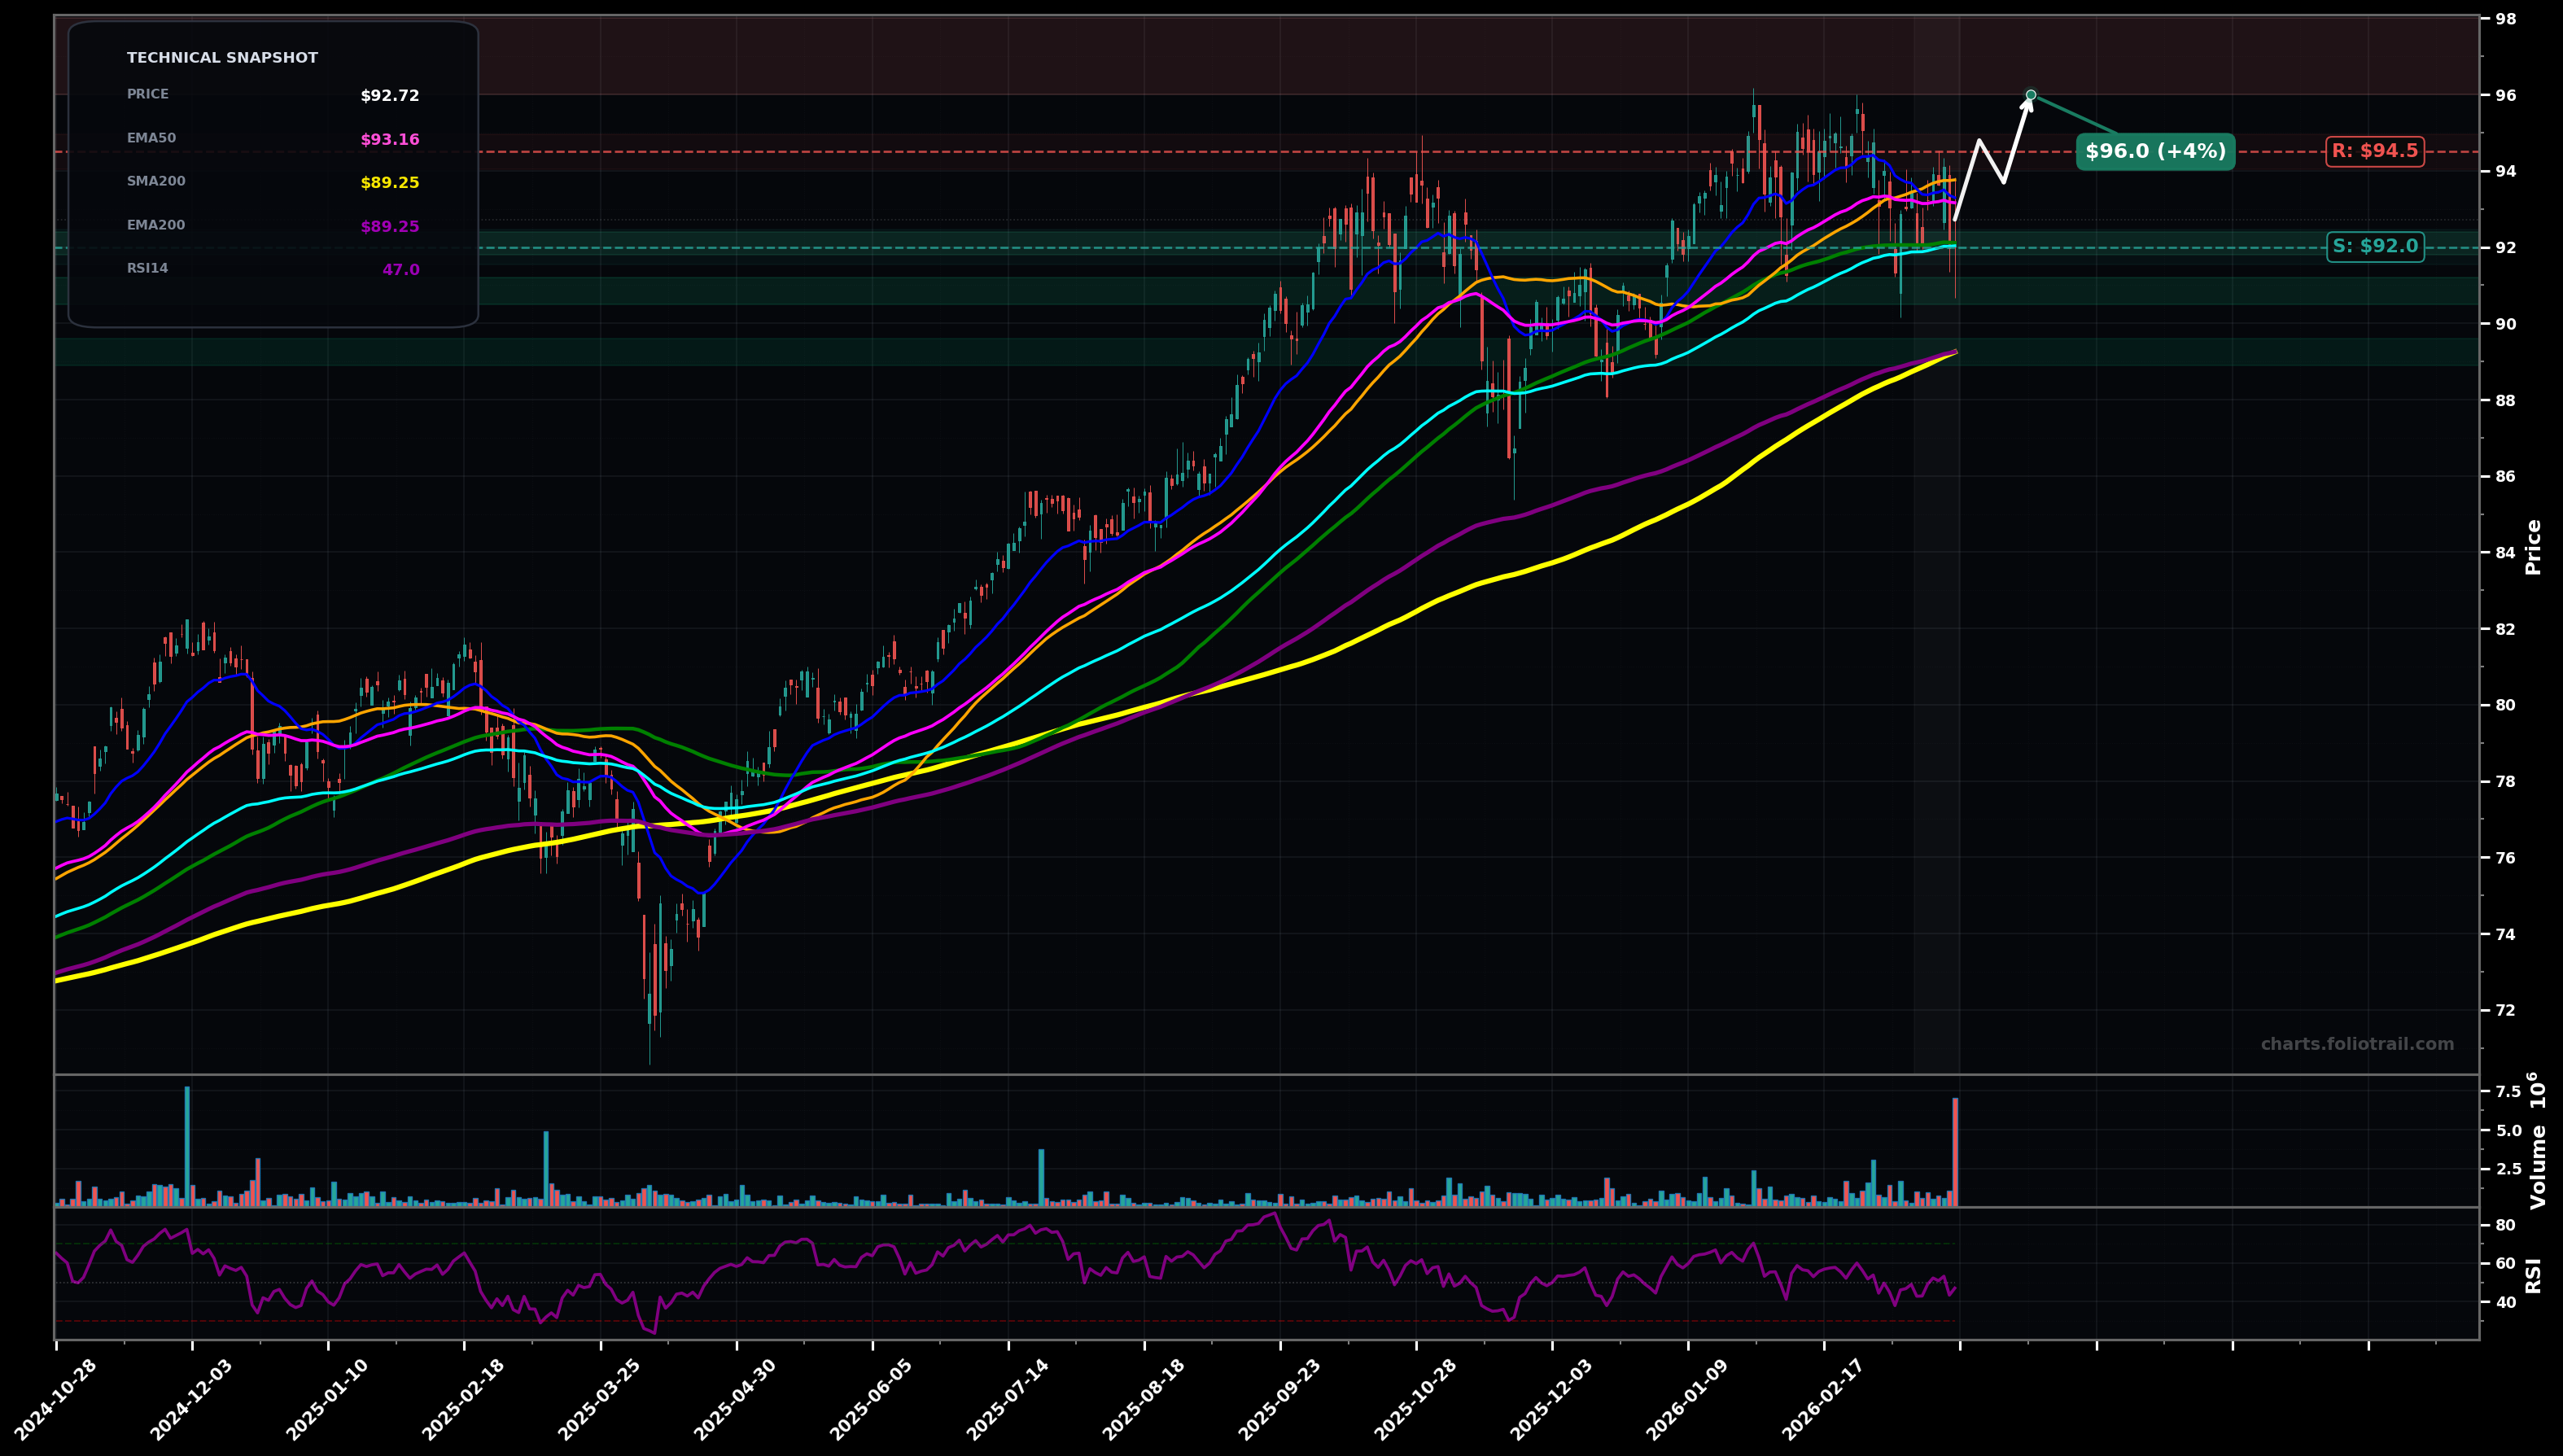
As of March 24, 2026, CWB (SPDR Bloomberg Convertible Securities ETF) is in a choppy range state on the daily chart, with a confidence level of 62%. Key support is at $92.0 and key resistance at $94.5. Price consolidating around $92–$94 after a strong uptrend; latest close ~$92.72 sitting below SMA50 ($93.76) but still above rising long-term MAs (SMA200/EMA200 ~$89.25).
Range resolves upward: reclaim and hold above EMA50/SMA50, then retest prior highs; fits an Elliott Wave view of a wave (4) consolidation within a larger wave (5) attempt.
Range breaks down: lose EMA100 and slip to the rising SMA200/EMA200 zone; this would align with a deeper wave (4) or an ABC correction from the recent highs.
2+ daily closes above $94.50 with follow-through toward $95+ (range breakout holding above the short MAs).
Daily close below $91.80 (clean loss of EMA100 ~$92.03 and range floor).
Scale-in around EMA100/range support ($92) first, add on a flush toward prior breakout area ($90–$91), and deploy heaviest near confluence of SMA200/EMA200 (~$89.25) and likely fib support of the prior impulse.
Trim into upside extension: prior high breakout zone first (~$96–$98), then larger reductions on a stretched wave-(5) advance above psychological $100, and close into a multi-year overextension band if price accelerates beyond prior structure.
As of March 24, 2026, CWB (SPDR Bloomberg Convertible Securities ETF) is in a choppy range state on the daily chart with 62% confidence. Price consolidating around $92–$94 after a strong uptrend; latest close ~$92.72 sitting below SMA50 ($93.76) but still above rising long-term MAs (SMA200/EMA200 ~$89.25).
On the daily timeframe, CWB has key support at $92.0 and key resistance at $94.5. The most likely scenario (bullish) targets $94.8 and $96.0, with a revert level at $93.7.
CWB (SPDR Bloomberg Convertible Securities ETF) is currently classified as choppy range on the daily chart, with 62% confidence. Confirmation requires: 2+ daily closes above $94.50 with follow-through toward $95+ (range breakout holding above the short MAs). This would be invalidated by: Daily close below $91.80 (clean loss of EMA100 ~$92.03 and range floor).
The most likely scenario (bullish) targets $94.8 and $96.0, with a revert level at $93.7. The alternative scenario (bearish) targets $90.8 and $89.3.
All content on this website — including charts, analysis, price targets, support/resistance levels, and position zones — is generated entirely by AI and provided for educational and informational purposes only.
This is not financial advice. NEXUSNOIR VENTURES SL (the operator of this website) is not a registered investment adviser or broker-dealer. You should not make investment decisions based solely on this information. Always do your own research and consult a qualified financial advisor.
By continuing, you acknowledge that you have read and agree to our full disclaimer & terms of use and privacy policy.