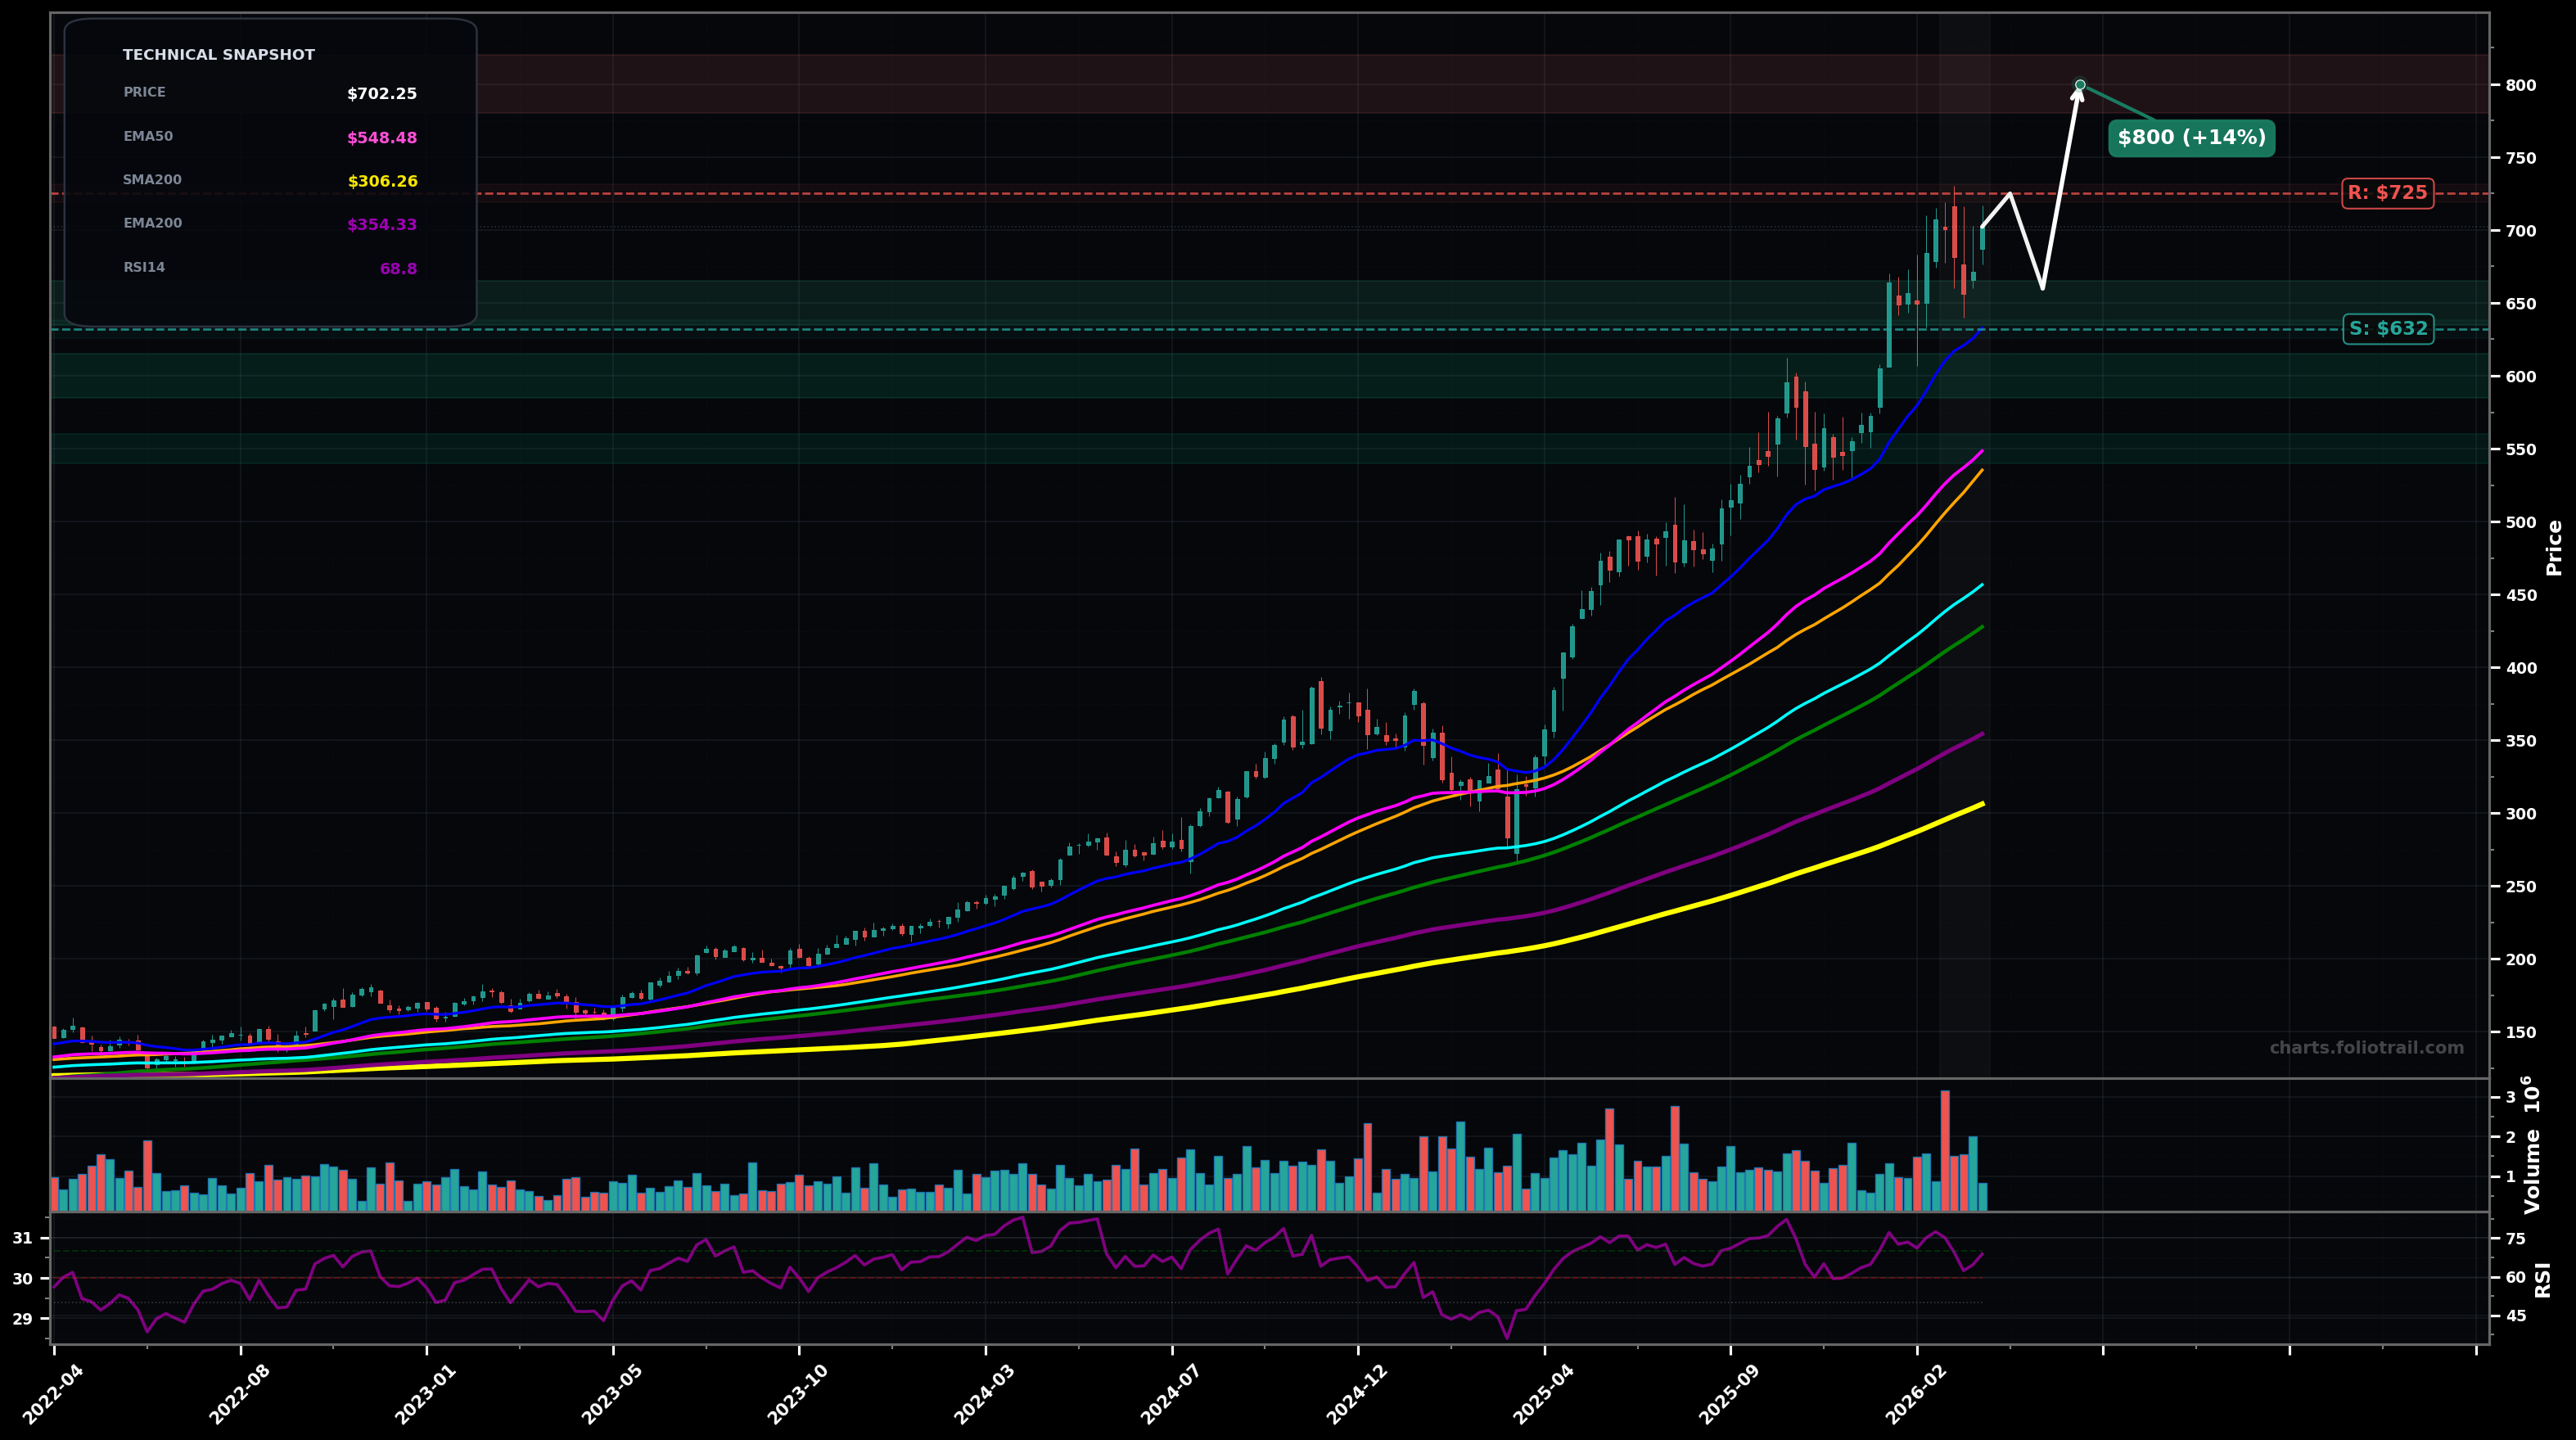
As of March 26, 2026, CW (Curtiss-Wright Corporation) is in a uptrend state on the weekly chart, with a confidence level of 78%. Key support is at $632 and key resistance at $725. Price at ~$702 is consolidating just below recent highs after a strong impulse leg; candles remain above rising EMA50/EMA100 with RSI ~69 (near overbought).
Bullish continuation: shallow pullback/sideways base above ~$632 then breakout to new highs; fits Elliott Wave impulse continuation (late Wave 3 / early Wave 5 behavior) with extensions.
Deeper corrective phase: weekly rejection near highs forms a LH, leading to an ABC-style pullback toward the rising EMA50 zone; trend intact unless supports fail.
Weekly close above $725 (new HH) with follow-through.
Weekly close below $632 (loss of EMA20/near-term swing support) followed by a second close below $600.
Buy-the-dip framework around Fibonacci retrace + dynamic supports: ~$635-$665 near EMA20/last breakout area; ~$585-$615 for deeper 0.382–0.5 style pullback; ~$540-$560 aligns with EMA50 (pink) / prior base support.
Trim into probable Wave-5/extension zones and fib projections: first around prior extension/round-number resistance, more trimming on further extension with RSI likely stretched, and full exit only on extreme multi-year overextension vs EMA50/EMA100 trend channel.
As of March 26, 2026, CW (Curtiss-Wright Corporation) is in a uptrend state on the weekly chart with 78% confidence. Price at ~$702 is consolidating just below recent highs after a strong impulse leg; candles remain above rising EMA50/EMA100 with RSI ~69 (near overbought).
On the weekly timeframe, CW has key support at $632 and key resistance at $725. The most likely scenario (bullish) targets $725 and $800, with a revert level at $660.
CW (Curtiss-Wright Corporation) is currently classified as uptrend on the weekly chart, with 78% confidence. Confirmation requires: Weekly close above $725 (new HH) with follow-through. This would be invalidated by: Weekly close below $632 (loss of EMA20/near-term swing support) followed by a second close below $600.
The most likely scenario (bullish) targets $725 and $800, with a revert level at $660. The alternative scenario (bearish) targets $600 and $550.
Multi-layer AI agents analyse 200+ stocks across daily, weekly, and monthly timeframes — producing market state classifications, price scenarios with targets, and position entry/exit levels. Updated every trading day after market close. No paywall. No sign-up required.
Built by Foliotrail.
All content on this website — including charts, analysis, price targets, support/resistance levels, and position zones — is generated entirely by AI and provided for educational and informational purposes only.
This is not financial advice. NEXUSNOIR VENTURES SL (the operator of this website) is not a registered investment adviser or broker-dealer. You should not make investment decisions based solely on this information. Always do your own research and consult a qualified financial advisor.
By continuing, you acknowledge that you have read and agree to our full disclaimer & terms of use and privacy policy.