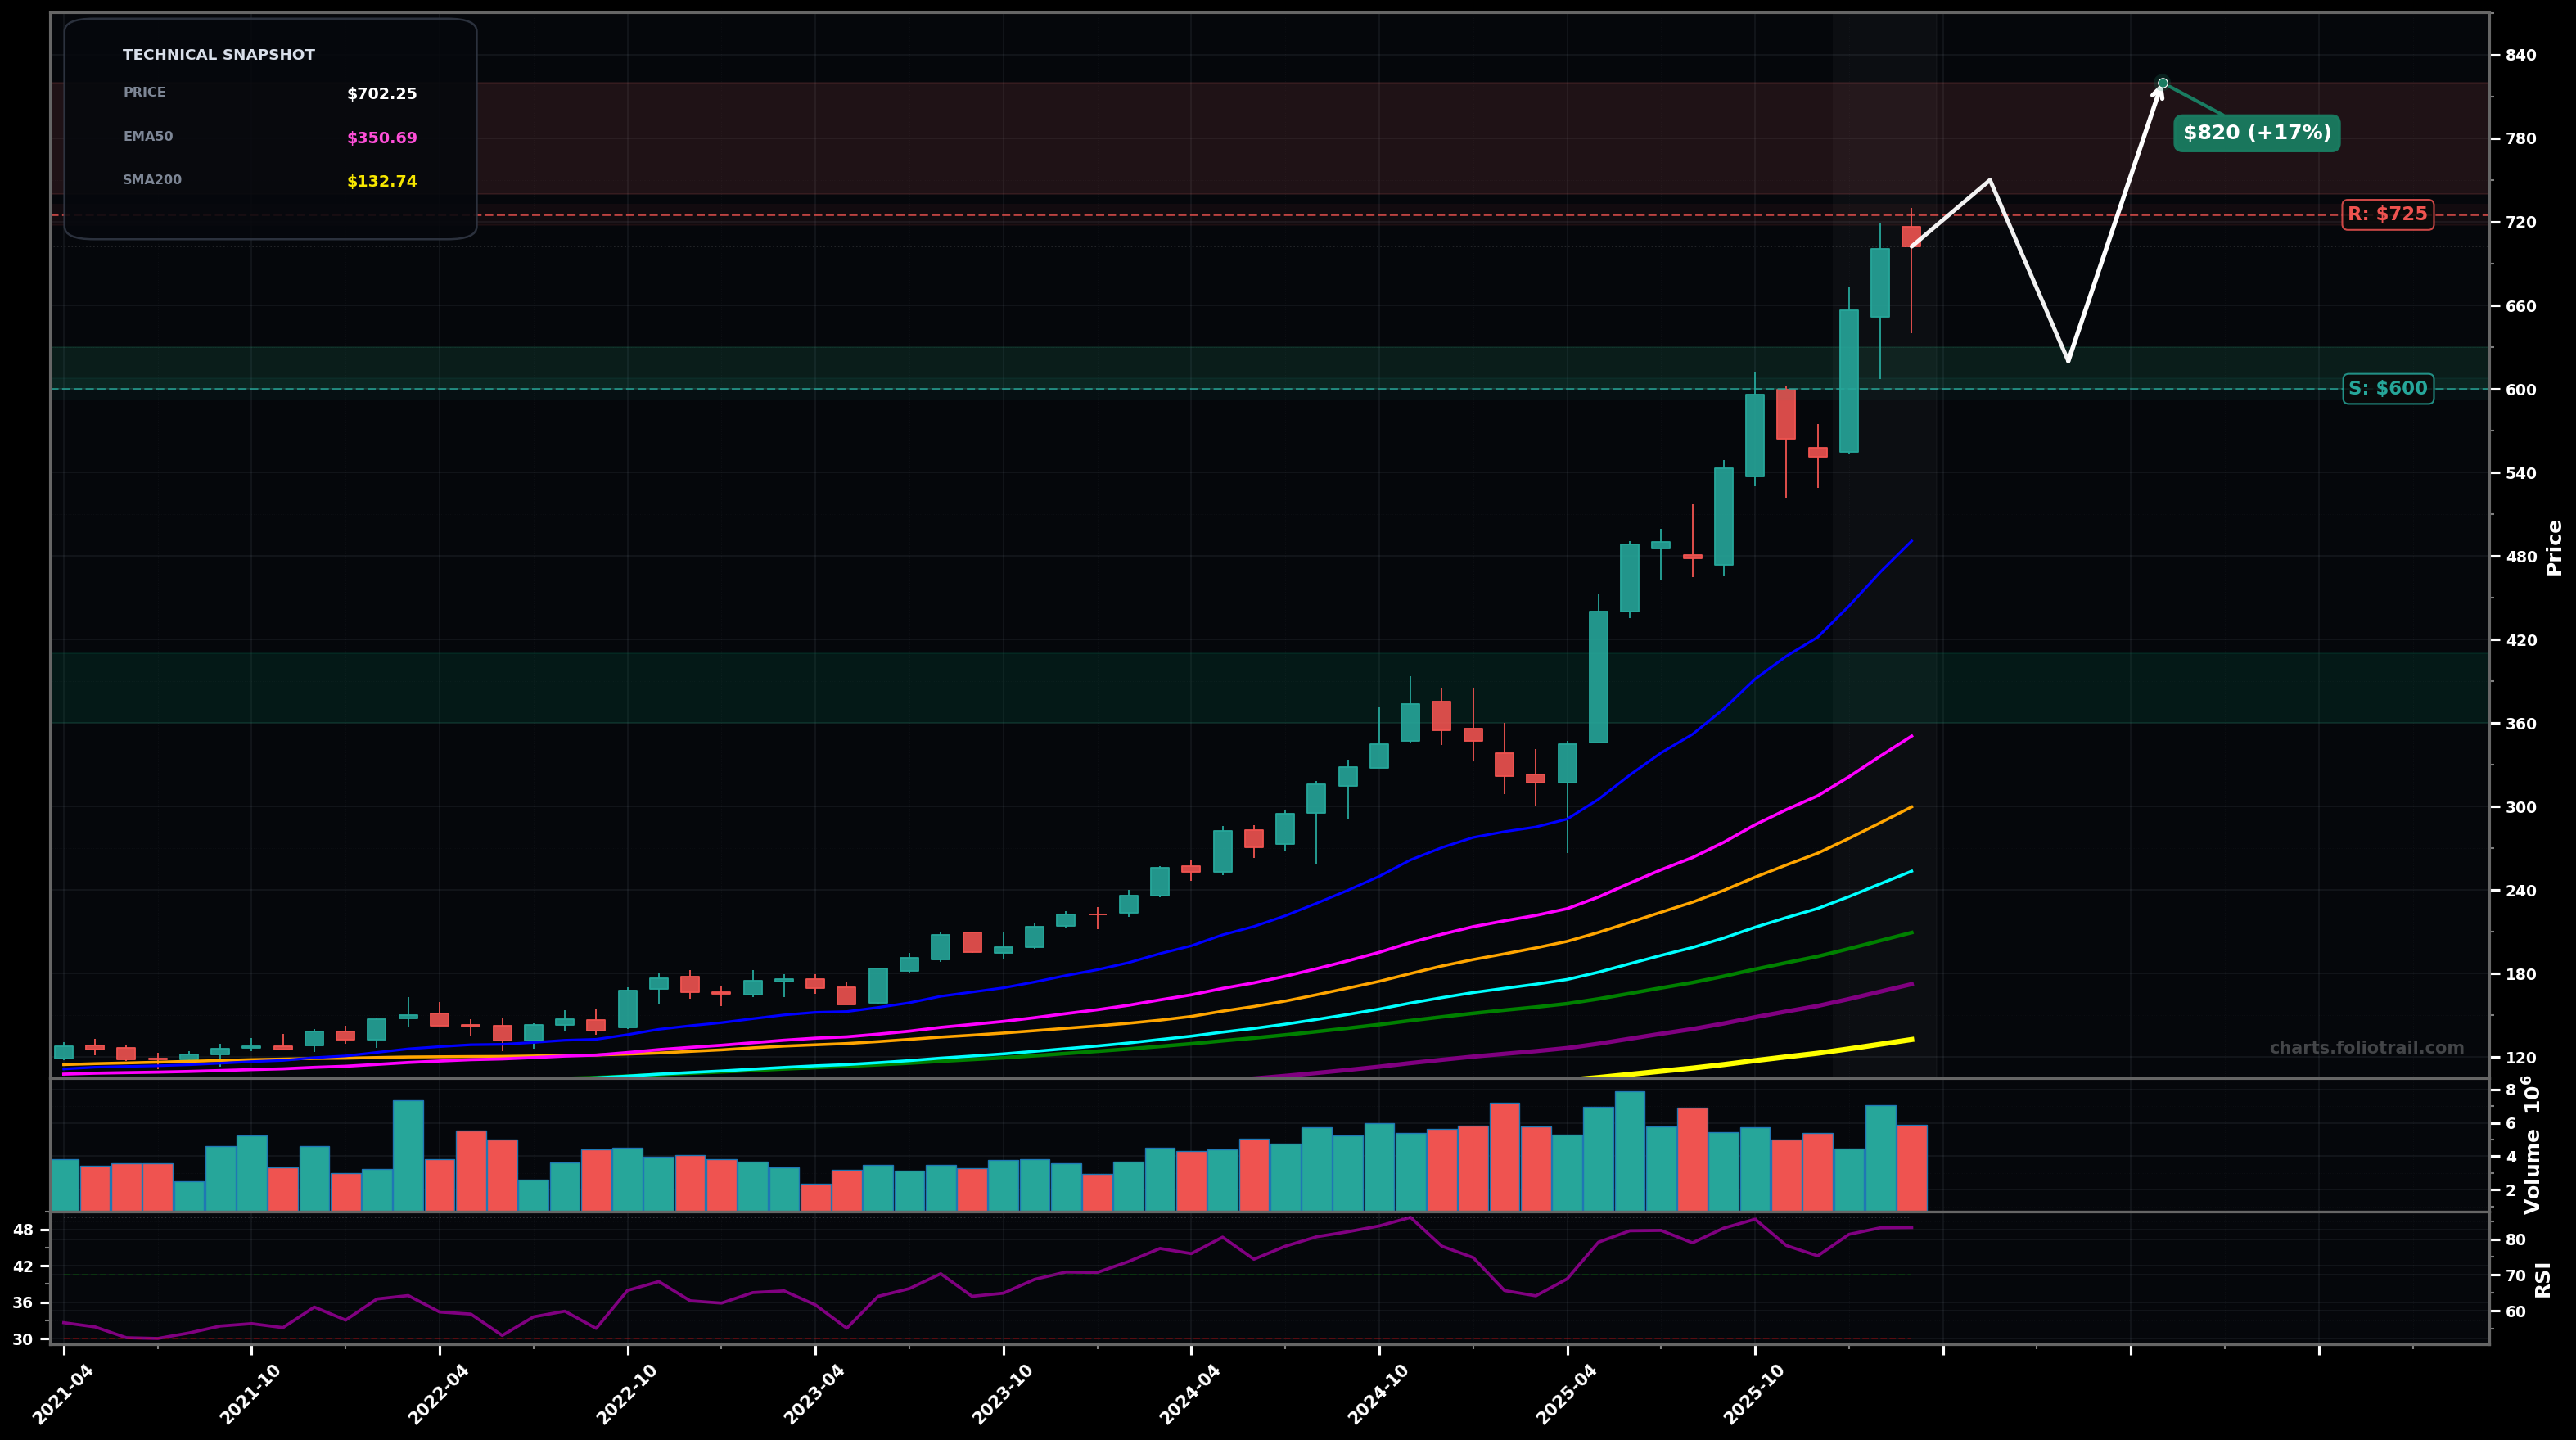
As of March 26, 2026, CW (Curtiss-Wright Corporation) is in a parabolic state on the monthly chart, with a confidence level of 74%. Key support is at $600 and key resistance at $725. Strong HH/HL monthly advance into ~$700s with a small pullback after a near-vertical leg; price far above all key MAs and RSI very overbought.
Parabolic uptrend pauses: a 1–3 month pullback/sideways digestion toward the prior breakout area, then a push to new highs if $600 holds (fits late Wave-5 extension / blow-off risk but trend intact).
Deeper mean-reversion: sharp correction from overextended RSI back toward the rising EMA20/EMA50 band, potentially completing a larger Wave-4 style retrace before any new impulse (watch for fast red closes near lows).
Monthly close above $725 with follow-through next month (another higher close).
Monthly close below $600 (break of the most recent swing low zone and momentum regime shift).
Buy-the-dip only: $600-$630 = prior breakout/swing support; $520-$560 ≈ ~23.6–38.2% pullback zone of the $300->$725 impulse; $360-$410 = EMA50 area/≈50% retrace and major trend reset level.
Trim into extension/new highs: $740-$820 = first fib extensions/psych level; $820-$900 = higher extension with elevated reversal risk in parabolic phase; $900-$1000 = extreme stretch vs EMA50/EMA100 where multi-year forward returns historically compress.
As of March 26, 2026, CW (Curtiss-Wright Corporation) is in a parabolic state on the monthly chart with 74% confidence. Strong HH/HL monthly advance into ~$700s with a small pullback after a near-vertical leg; price far above all key MAs and RSI very overbought.
On the monthly timeframe, CW has key support at $600 and key resistance at $725. The most likely scenario (bullish) targets $750 and $820, with a revert level at $620.
CW (Curtiss-Wright Corporation) is currently classified as parabolic on the monthly chart, with 74% confidence. Confirmation requires: Monthly close above $725 with follow-through next month (another higher close). This would be invalidated by: Monthly close below $600 (break of the most recent swing low zone and momentum regime shift).
The most likely scenario (bullish) targets $750 and $820, with a revert level at $620. The alternative scenario (bearish) targets $520 and $360.
Multi-layer AI agents analyse 200+ stocks across daily, weekly, and monthly timeframes — producing market state classifications, price scenarios with targets, and position entry/exit levels. Updated every trading day after market close. No paywall. No sign-up required.
Built by Foliotrail.
All content on this website — including charts, analysis, price targets, support/resistance levels, and position zones — is generated entirely by AI and provided for educational and informational purposes only.
This is not financial advice. NEXUSNOIR VENTURES SL (the operator of this website) is not a registered investment adviser or broker-dealer. You should not make investment decisions based solely on this information. Always do your own research and consult a qualified financial advisor.
By continuing, you acknowledge that you have read and agree to our full disclaimer & terms of use and privacy policy.