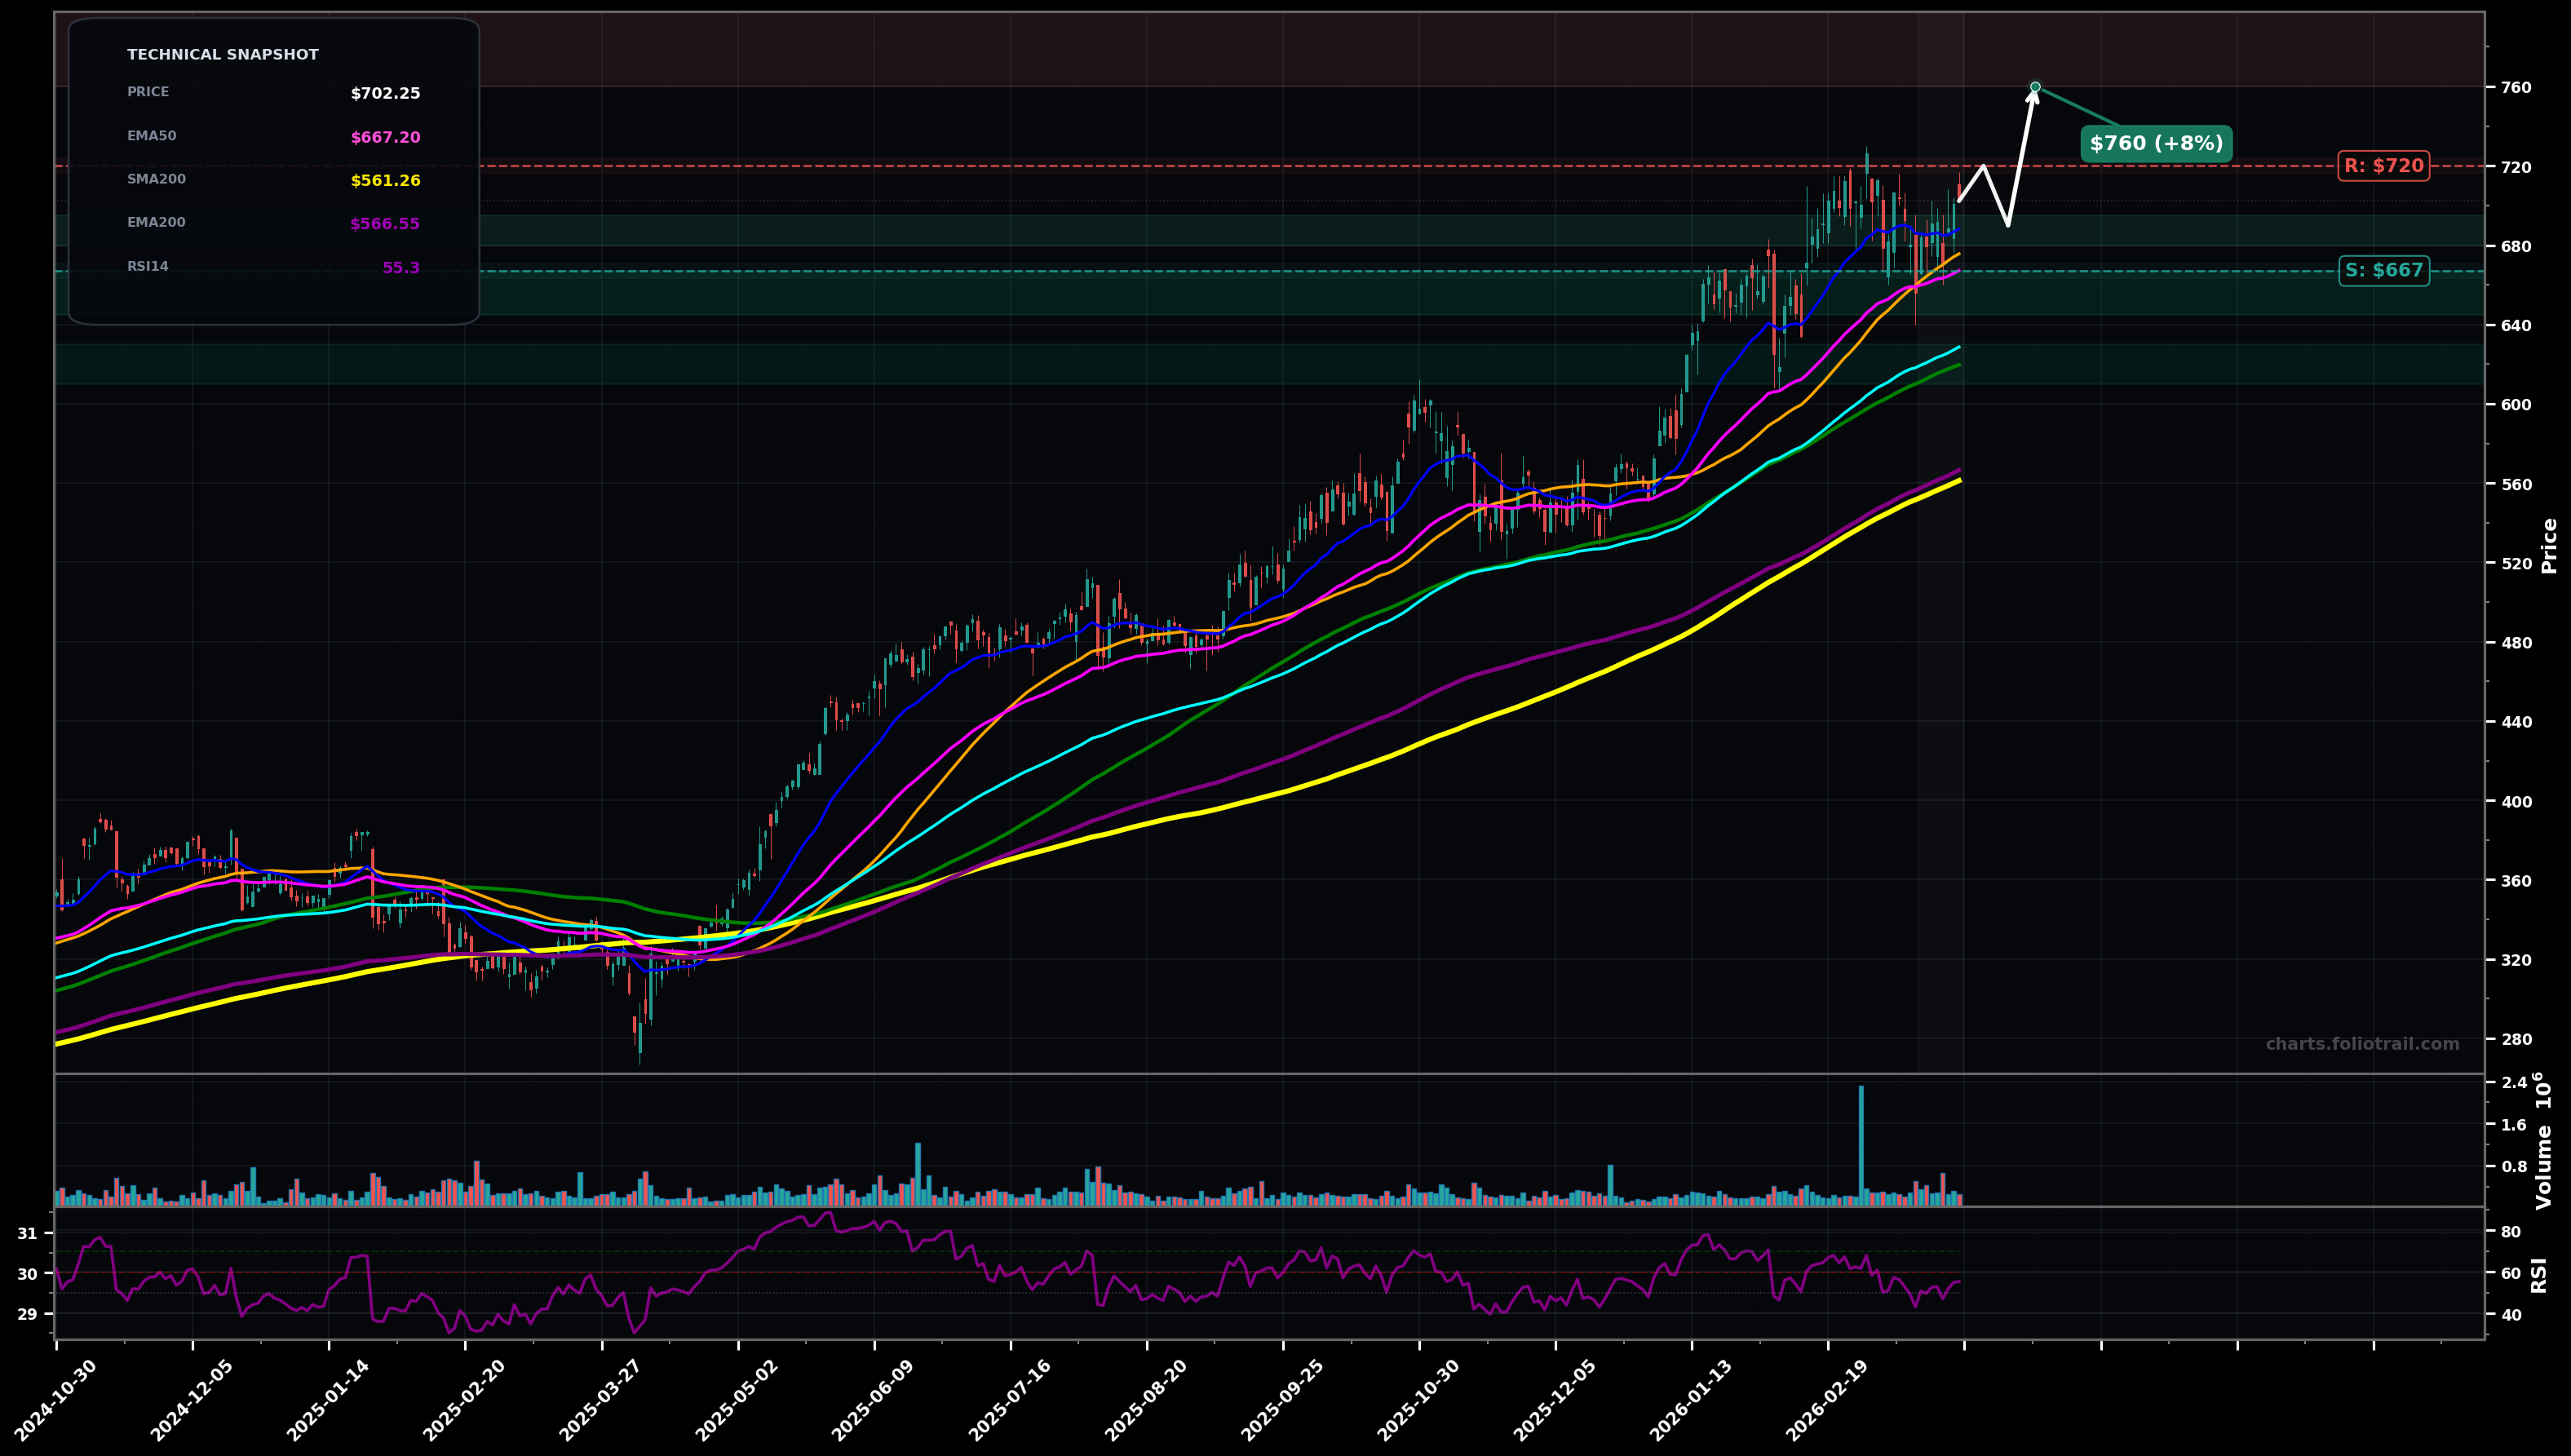
As of March 26, 2026, CW (Curtiss-Wright Corporation) is in a uptrend state on the daily chart, with a confidence level of 72%. Key support is at $667 and key resistance at $720. Price ~$702.25 is holding above clustered short MAs (EMA50/SMA50) after a mild pullback from the ~$720 swing high; RSI ~55 suggests consolidation within an uptrend.
Bullish continuation: shallow dip/sideways near $690–$705, then breakout over the $720 pivot and continuation toward the next fib extension zone.
Deeper pullback (wave 4-style) into the rising EMA100/SMA100 area; holds $620–$630 then attempts a new leg higher, otherwise risks a larger correction toward the EMA200.
Daily close above $720 (break of prior swing high) with follow-through
Daily close below $660 (loss of EMA50/SMA50 cluster and prior swing support)
Scale in on pullbacks to the rising EMA50/SMA50 first, then EMA100, with highest conviction demand likely near the prior consolidation + EMA100/SMA100 band.
Trim into fib-extension/psychological zones above the $720 breakout where price would likely be increasingly stretched vs EMA50/EMA100 and mean-reversion risk rises.
As of March 26, 2026, CW (Curtiss-Wright Corporation) is in a uptrend state on the daily chart with 72% confidence. Price ~$702.25 is holding above clustered short MAs (EMA50/SMA50) after a mild pullback from the ~$720 swing high; RSI ~55 suggests consolidation within an uptrend.
On the daily timeframe, CW has key support at $667 and key resistance at $720. The most likely scenario (bullish) targets $720 and $760, with a revert level at $690.
CW (Curtiss-Wright Corporation) is currently classified as uptrend on the daily chart, with 72% confidence. Confirmation requires: Daily close above $720 (break of prior swing high) with follow-through This would be invalidated by: Daily close below $660 (loss of EMA50/SMA50 cluster and prior swing support)
The most likely scenario (bullish) targets $720 and $760, with a revert level at $690. The alternative scenario (bearish) targets $630 and $570.
Multi-layer AI agents analyse 200+ stocks across daily, weekly, and monthly timeframes — producing market state classifications, price scenarios with targets, and position entry/exit levels. Updated every trading day after market close. No paywall. No sign-up required.
Built by Foliotrail.
All content on this website — including charts, analysis, price targets, support/resistance levels, and position zones — is generated entirely by AI and provided for educational and informational purposes only.
This is not financial advice. NEXUSNOIR VENTURES SL (the operator of this website) is not a registered investment adviser or broker-dealer. You should not make investment decisions based solely on this information. Always do your own research and consult a qualified financial advisor.
By continuing, you acknowledge that you have read and agree to our full disclaimer & terms of use and privacy policy.