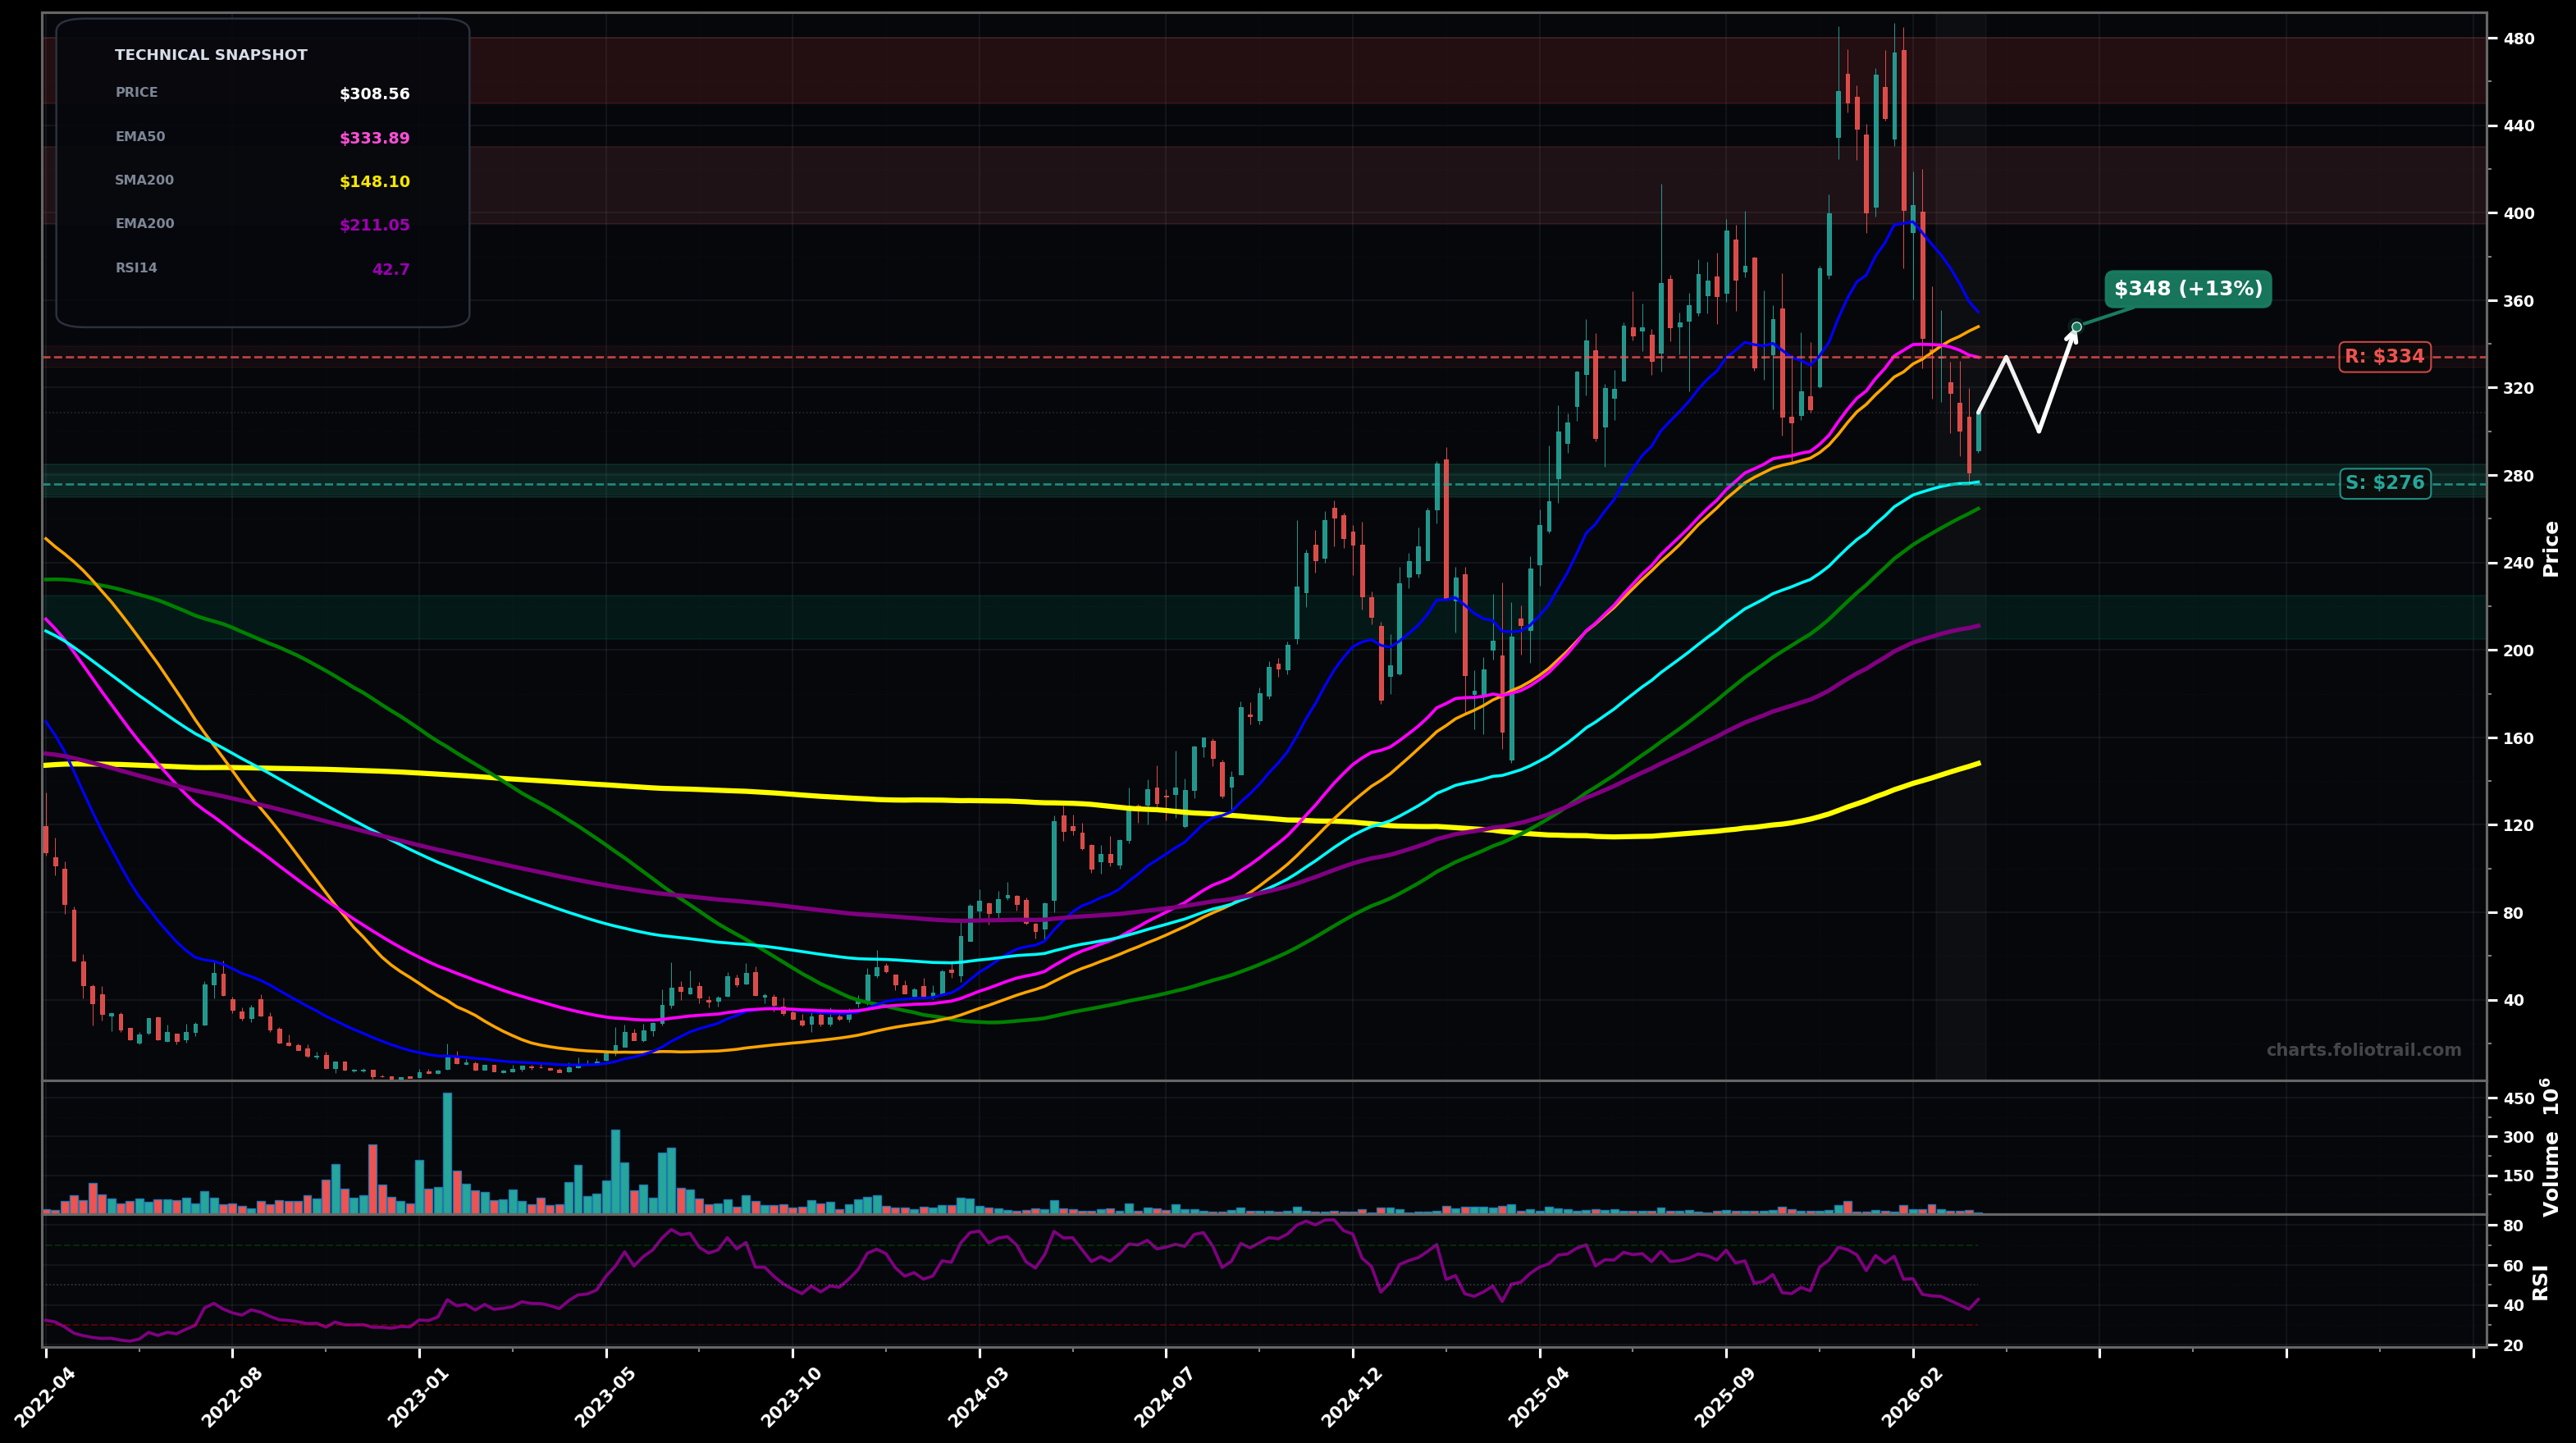
As of March 26, 2026, CVNA (Carvana Co.) is in a downtrend state on the weekly chart, with a confidence level of 72%. Key support is at $276 and key resistance at $334. Sharp pullback from the ~$480 spike with consecutive lower highs/lower lows; price (~$308.56) is below EMA50 (~$333.89) and SMA50 (~$347.89) but still above EMA100 (~$276.84).
Base-building pullback: hold $276–$280 (EMA100 area), chop for a few weeks, then rebound toward EMA50/overhead supply.
Continuation selloff: lose $276 (EMA100) and slide toward the long-term trend supports (EMA200/SMA100 cluster), consistent with a larger Elliott Wave correction leg.
Weekly close below $276 would confirm the downtrend as a deeper breakdown (loss of EMA100).
Weekly close back above $334 (EMA50) would invalidate the current downtrend label and shift toward a reversal attempt.
Start near EMA100 support ($276); add on breakdown into prior consolidation/mean-reversion zone ($240–$265); heavy add near EMA200 (~$211) where larger-degree wave (4)/(A) often terminates.
Trim into major overhead supply from the prior spike (~$400+); heavier trims into the ~$450–$480 prior top; close if price extends into a fresh blow-off above prior ATH zone (~$500+) where risk/reward becomes asymmetric.
As of March 26, 2026, CVNA (Carvana Co.) is in a downtrend state on the weekly chart with 72% confidence. Sharp pullback from the ~$480 spike with consecutive lower highs/lower lows; price (~$308.56) is below EMA50 (~$333.89) and SMA50 (~$347.89) but still above EMA100 (~$276.84).
On the weekly timeframe, CVNA has key support at $276 and key resistance at $334. The most likely scenario (bullish) targets $334 and $348, with a revert level at $300.
CVNA (Carvana Co.) is currently classified as downtrend on the weekly chart, with 72% confidence. Confirmation requires: Weekly close below $276 would confirm the downtrend as a deeper breakdown (loss of EMA100). This would be invalidated by: Weekly close back above $334 (EMA50) would invalidate the current downtrend label and shift toward a reversal attempt.
The most likely scenario (bullish) targets $334 and $348, with a revert level at $300. The alternative scenario (bearish) targets $264 and $211.
Multi-layer AI agents analyse 200+ stocks across daily, weekly, and monthly timeframes — producing market state classifications, price scenarios with targets, and position entry/exit levels. Updated every trading day after market close. No paywall. No sign-up required.
Built by Foliotrail.
All content on this website — including charts, analysis, price targets, support/resistance levels, and position zones — is generated entirely by AI and provided for educational and informational purposes only.
This is not financial advice. NEXUSNOIR VENTURES SL (the operator of this website) is not a registered investment adviser or broker-dealer. You should not make investment decisions based solely on this information. Always do your own research and consult a qualified financial advisor.
By continuing, you acknowledge that you have read and agree to our full disclaimer & terms of use and privacy policy.