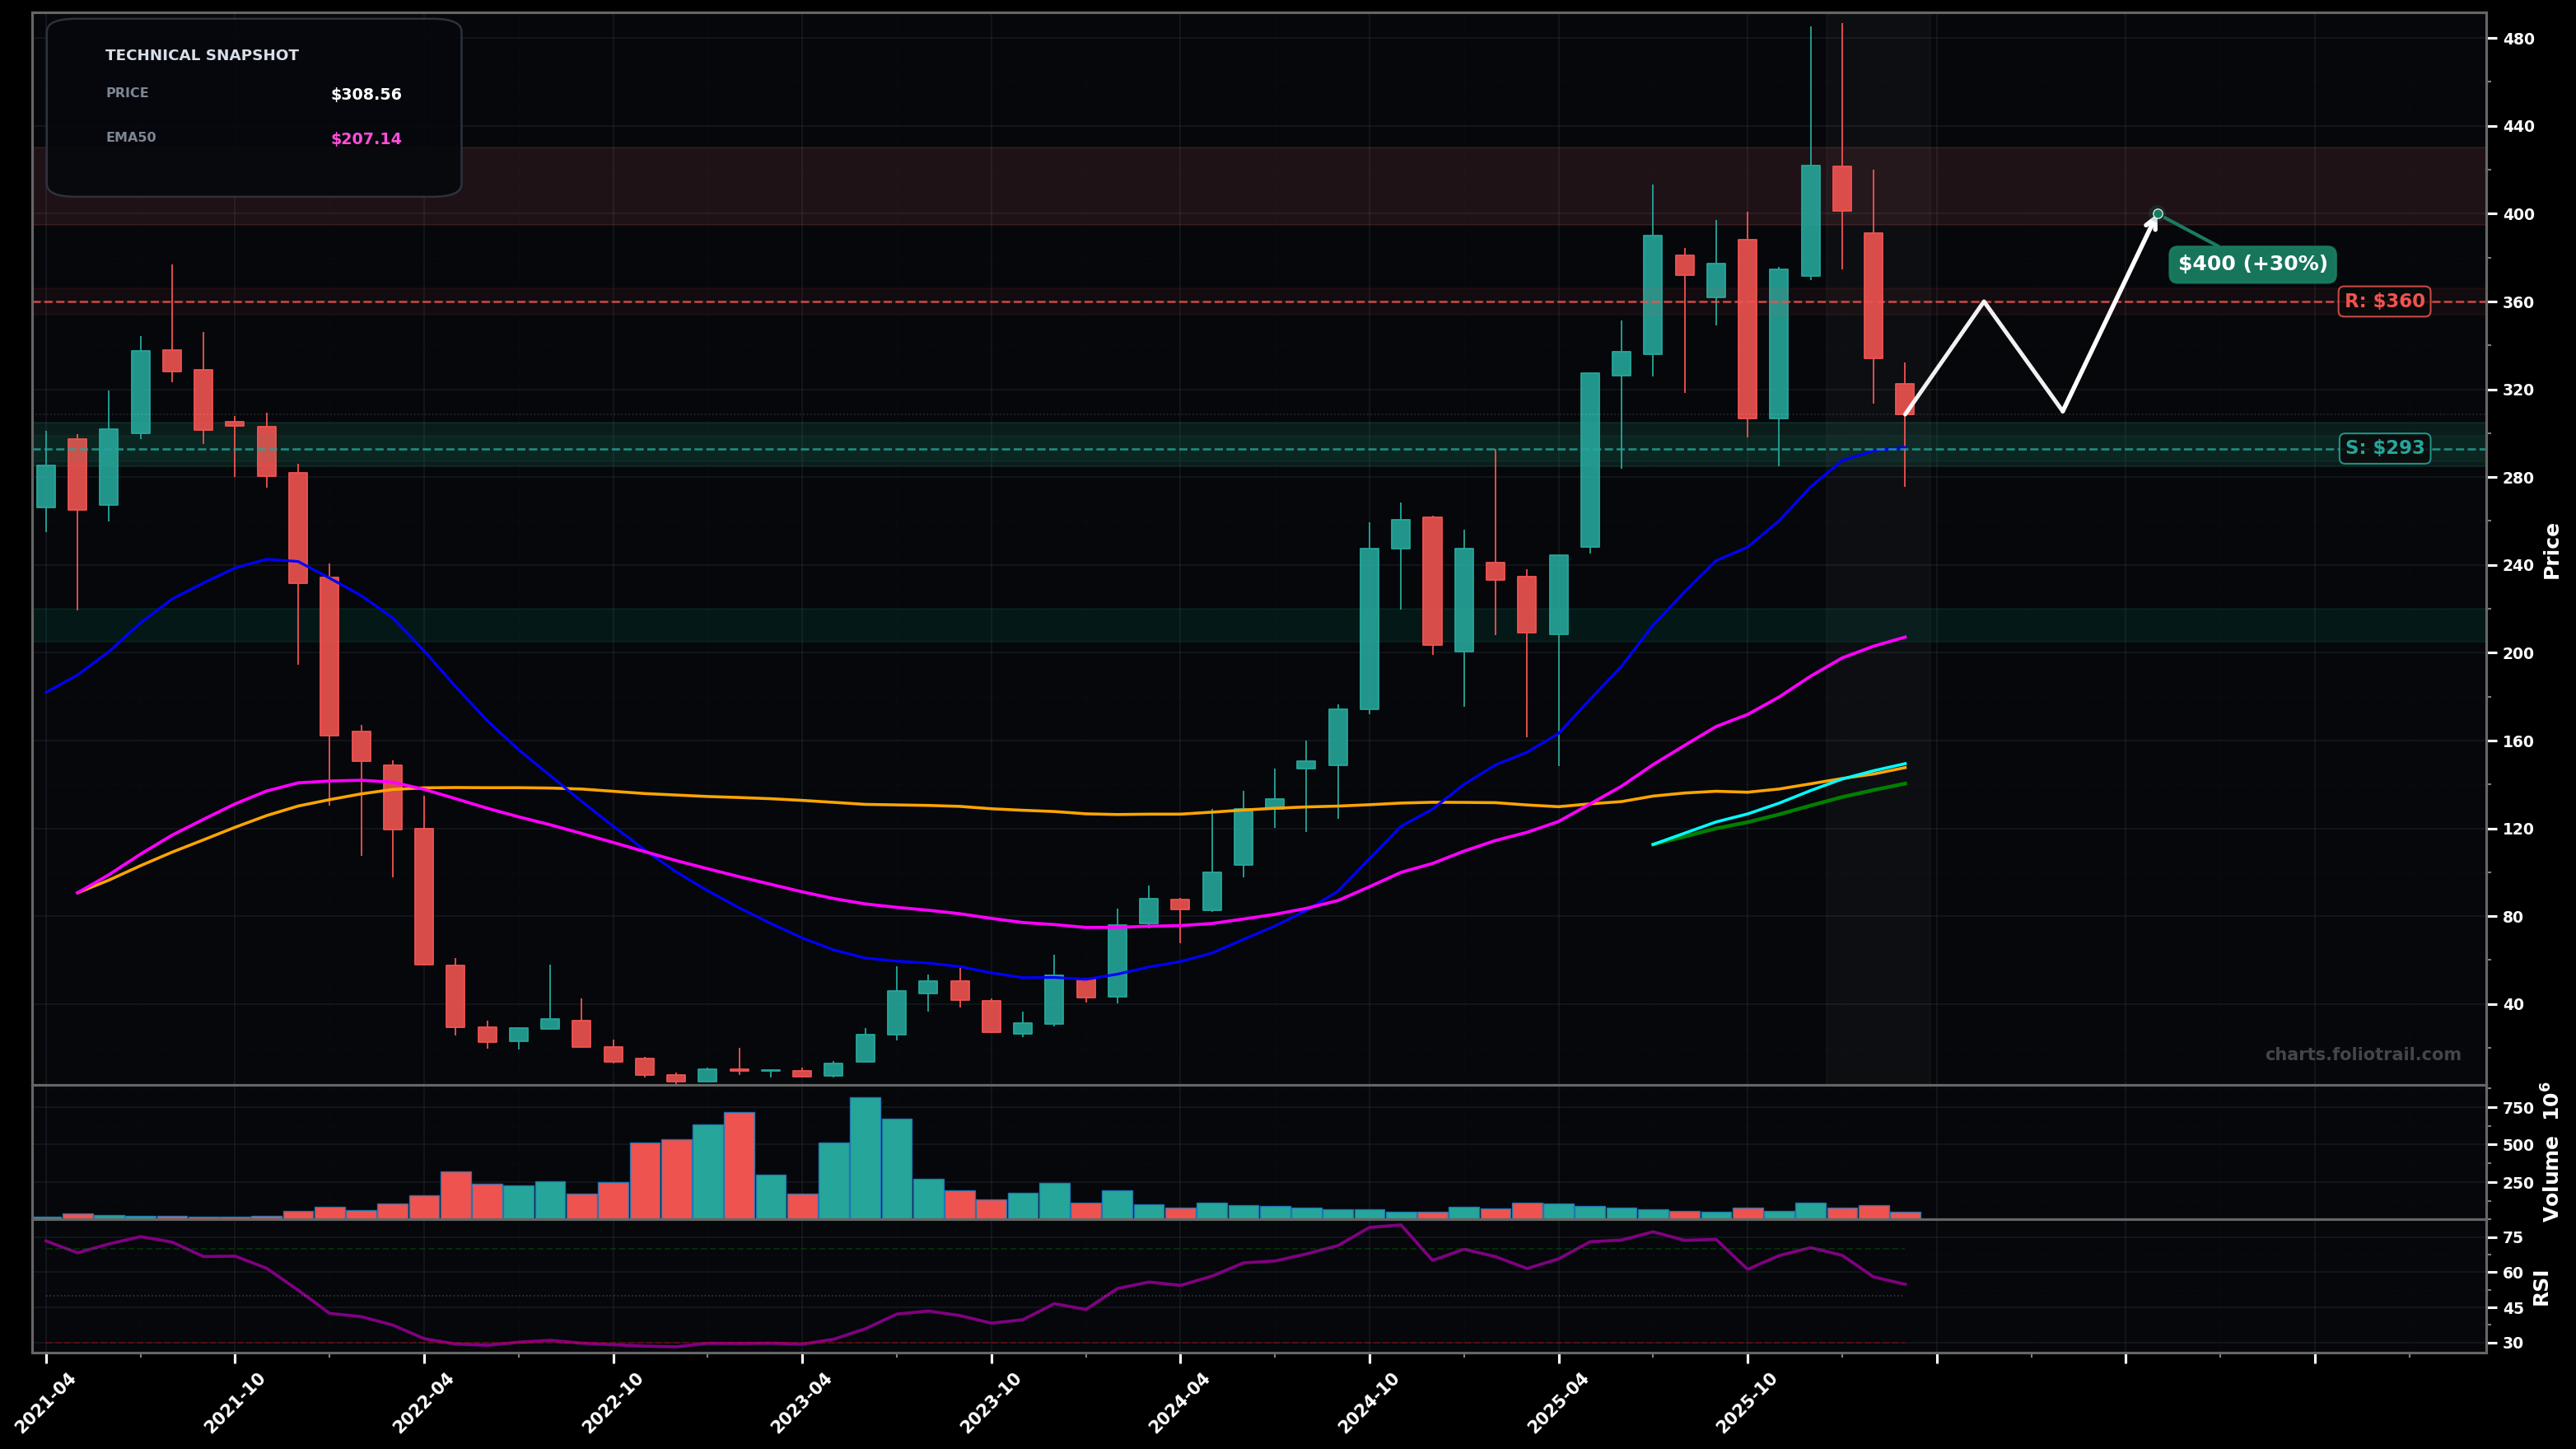
As of March 26, 2026, CVNA (Carvana Co.) is in a volatility expansion state on the monthly chart, with a confidence level of 68%. Key support is at $293 and key resistance at $360. Monthly pullback from the ~$480 spike high; last close ~$308.56 sitting near the EMA20 (~$293.56) after a volatile topping sequence.
Bullish consolidation: price holds the EMA20/$293 area, builds a higher low, then re-attempts the $360-$400 supply zone; if reclaimed, continuation toward the prior spike area becomes plausible (Elliott: wave (4) pullback completing before wave (5) attempt).
Deeper corrective leg: failure to hold $293 leads to a wave (4) style retrace toward the prior breakout/mean reversion area near EMA50; buyers likely defend between ~$250-$210, but a decisive loss would shift to a larger correction.
2 monthly closes holding above $293 and then a break/close above $360
Monthly close below $293 (loss of EMA20) followed by a close below $280
Scale-in around EMA20 support first, then add on a typical Fib/structure retrace toward prior breakout zone, heavy add near EMA50 where trend support is most meaningful on monthly.
Trim into overhead supply near the $400 handle and prior distribution zone; heavier trims/exit if price revisits/exceeds the blow-off region where reversal risk rises sharply on monthly volatility.
As of March 26, 2026, CVNA (Carvana Co.) is in a volatility expansion state on the monthly chart with 68% confidence. Monthly pullback from the ~$480 spike high; last close ~$308.56 sitting near the EMA20 (~$293.56) after a volatile topping sequence.
On the monthly timeframe, CVNA has key support at $293 and key resistance at $360. The most likely scenario (bullish) targets $360 and $400, with a revert level at $310.
CVNA (Carvana Co.) is currently classified as volatility expansion on the monthly chart, with 68% confidence. Confirmation requires: 2 monthly closes holding above $293 and then a break/close above $360 This would be invalidated by: Monthly close below $293 (loss of EMA20) followed by a close below $280
The most likely scenario (bullish) targets $360 and $400, with a revert level at $310. The alternative scenario (bearish) targets $250 and $210.
Multi-layer AI agents analyse 200+ stocks across daily, weekly, and monthly timeframes — producing market state classifications, price scenarios with targets, and position entry/exit levels. Updated every trading day after market close. No paywall. No sign-up required.
Built by Foliotrail.
All content on this website — including charts, analysis, price targets, support/resistance levels, and position zones — is generated entirely by AI and provided for educational and informational purposes only.
This is not financial advice. NEXUSNOIR VENTURES SL (the operator of this website) is not a registered investment adviser or broker-dealer. You should not make investment decisions based solely on this information. Always do your own research and consult a qualified financial advisor.
By continuing, you acknowledge that you have read and agree to our full disclaimer & terms of use and privacy policy.