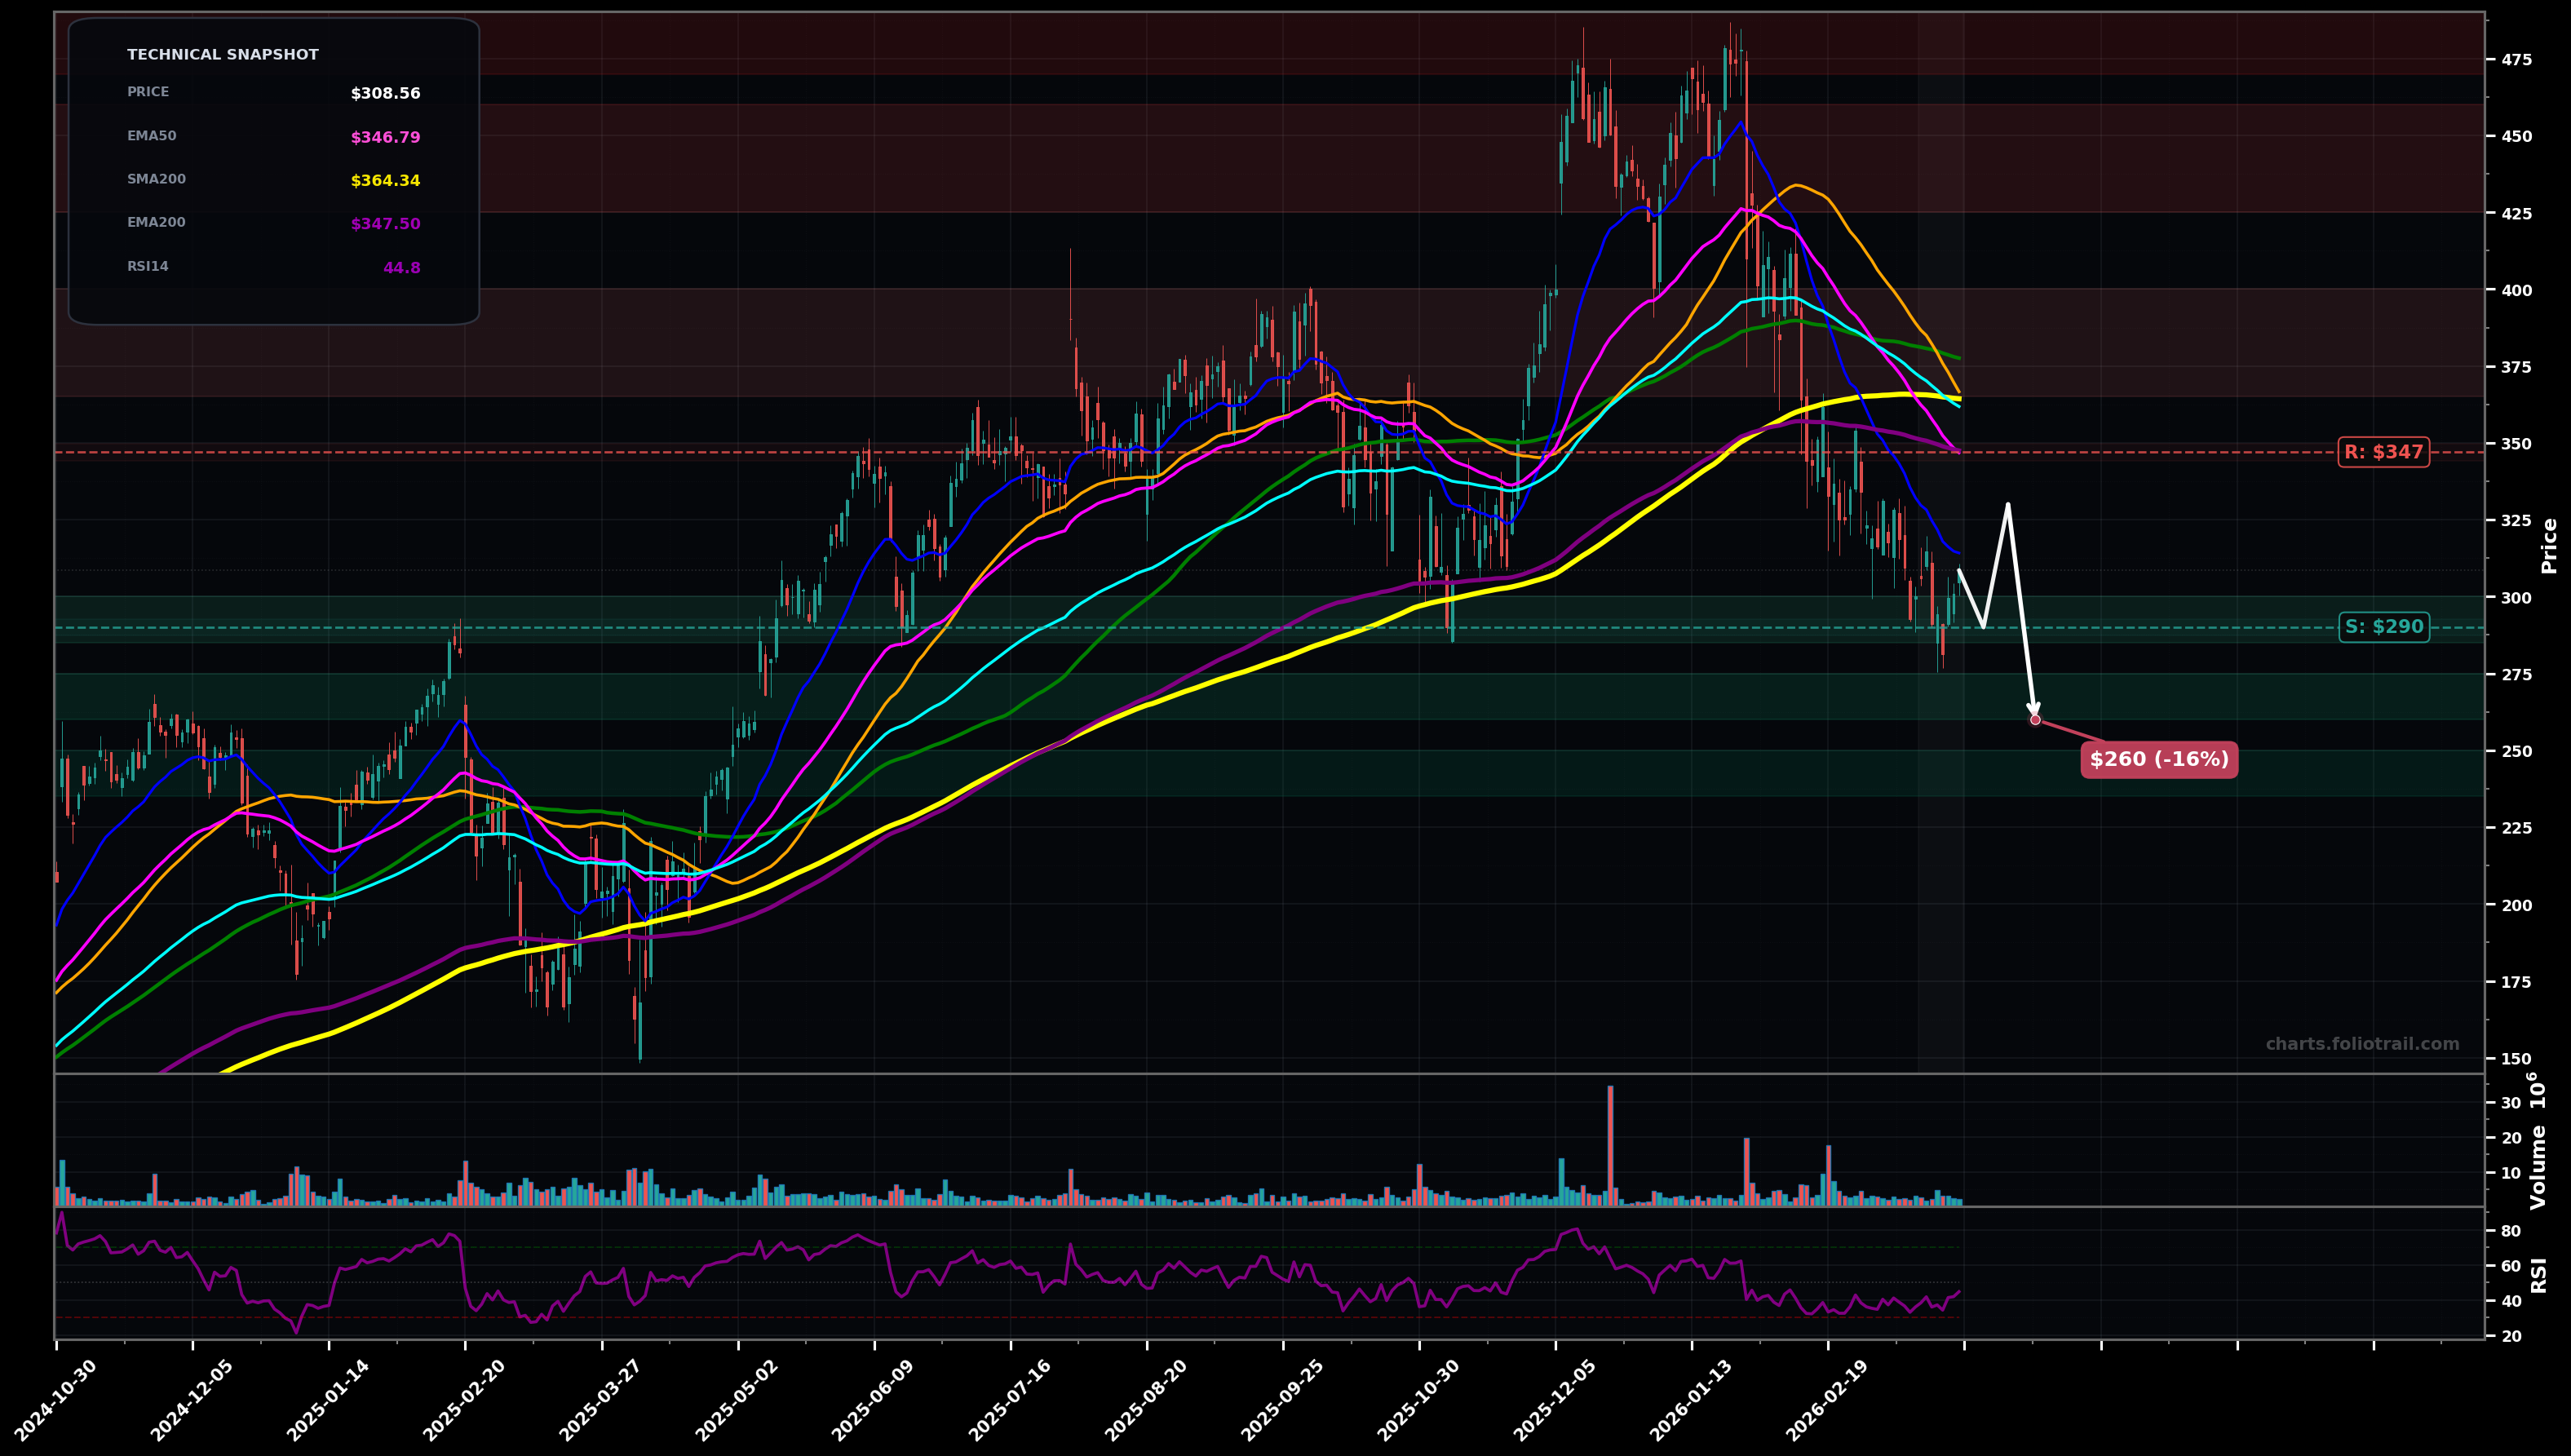
As of March 26, 2026, CVNA (Carvana Co.) is in a falling knife state on the daily chart, with a confidence level of 72%. Key support is at $290 and key resistance at $347. Sharp selloff from ~$480 peak into a lower-low sequence; current bounce attempt to ~$309 still below all key EMAs/SMAs.
Bear-market continuation: price rejects the $330–$347 MA cluster, retests $290, then extends to the next demand zone near the prior consolidation/swing area.
Relief rally / breakout-reversal attempt: price forms a higher low above ~$290 and squeezes through the $347 cluster, targeting the next resistance shelf from the breakdown.
Daily close below $290 (break of the most recent swing-low area) with follow-through.
Two+ daily closes back above $347 (EMA200/EMA50 cluster reclaim).
Buy zones are aligned to the current swing-low support (~$290) then the next likely Fibonacci/structure pockets (~$270, ~$240) if the knife continues.
Trim into major overhead supply: first the MA/shelf area ($365–$400), then the breakdown zone ($425–$460), with full exit into prior wave-5 peak region (~$480+).
As of March 26, 2026, CVNA (Carvana Co.) is in a falling knife state on the daily chart with 72% confidence. Sharp selloff from ~$480 peak into a lower-low sequence; current bounce attempt to ~$309 still below all key EMAs/SMAs.
On the daily timeframe, CVNA has key support at $290 and key resistance at $347. The most likely scenario (bearish) targets $290 and $260, with a revert level at $330.
CVNA (Carvana Co.) is currently classified as falling knife on the daily chart, with 72% confidence. Confirmation requires: Daily close below $290 (break of the most recent swing-low area) with follow-through. This would be invalidated by: Two+ daily closes back above $347 (EMA200/EMA50 cluster reclaim).
The most likely scenario (bearish) targets $290 and $260, with a revert level at $330. The alternative scenario (bullish) targets $365 and $400.
Multi-layer AI agents analyse 200+ stocks across daily, weekly, and monthly timeframes — producing market state classifications, price scenarios with targets, and position entry/exit levels. Updated every trading day after market close. No paywall. No sign-up required.
Built by Foliotrail.
All content on this website — including charts, analysis, price targets, support/resistance levels, and position zones — is generated entirely by AI and provided for educational and informational purposes only.
This is not financial advice. NEXUSNOIR VENTURES SL (the operator of this website) is not a registered investment adviser or broker-dealer. You should not make investment decisions based solely on this information. Always do your own research and consult a qualified financial advisor.
By continuing, you acknowledge that you have read and agree to our full disclaimer & terms of use and privacy policy.