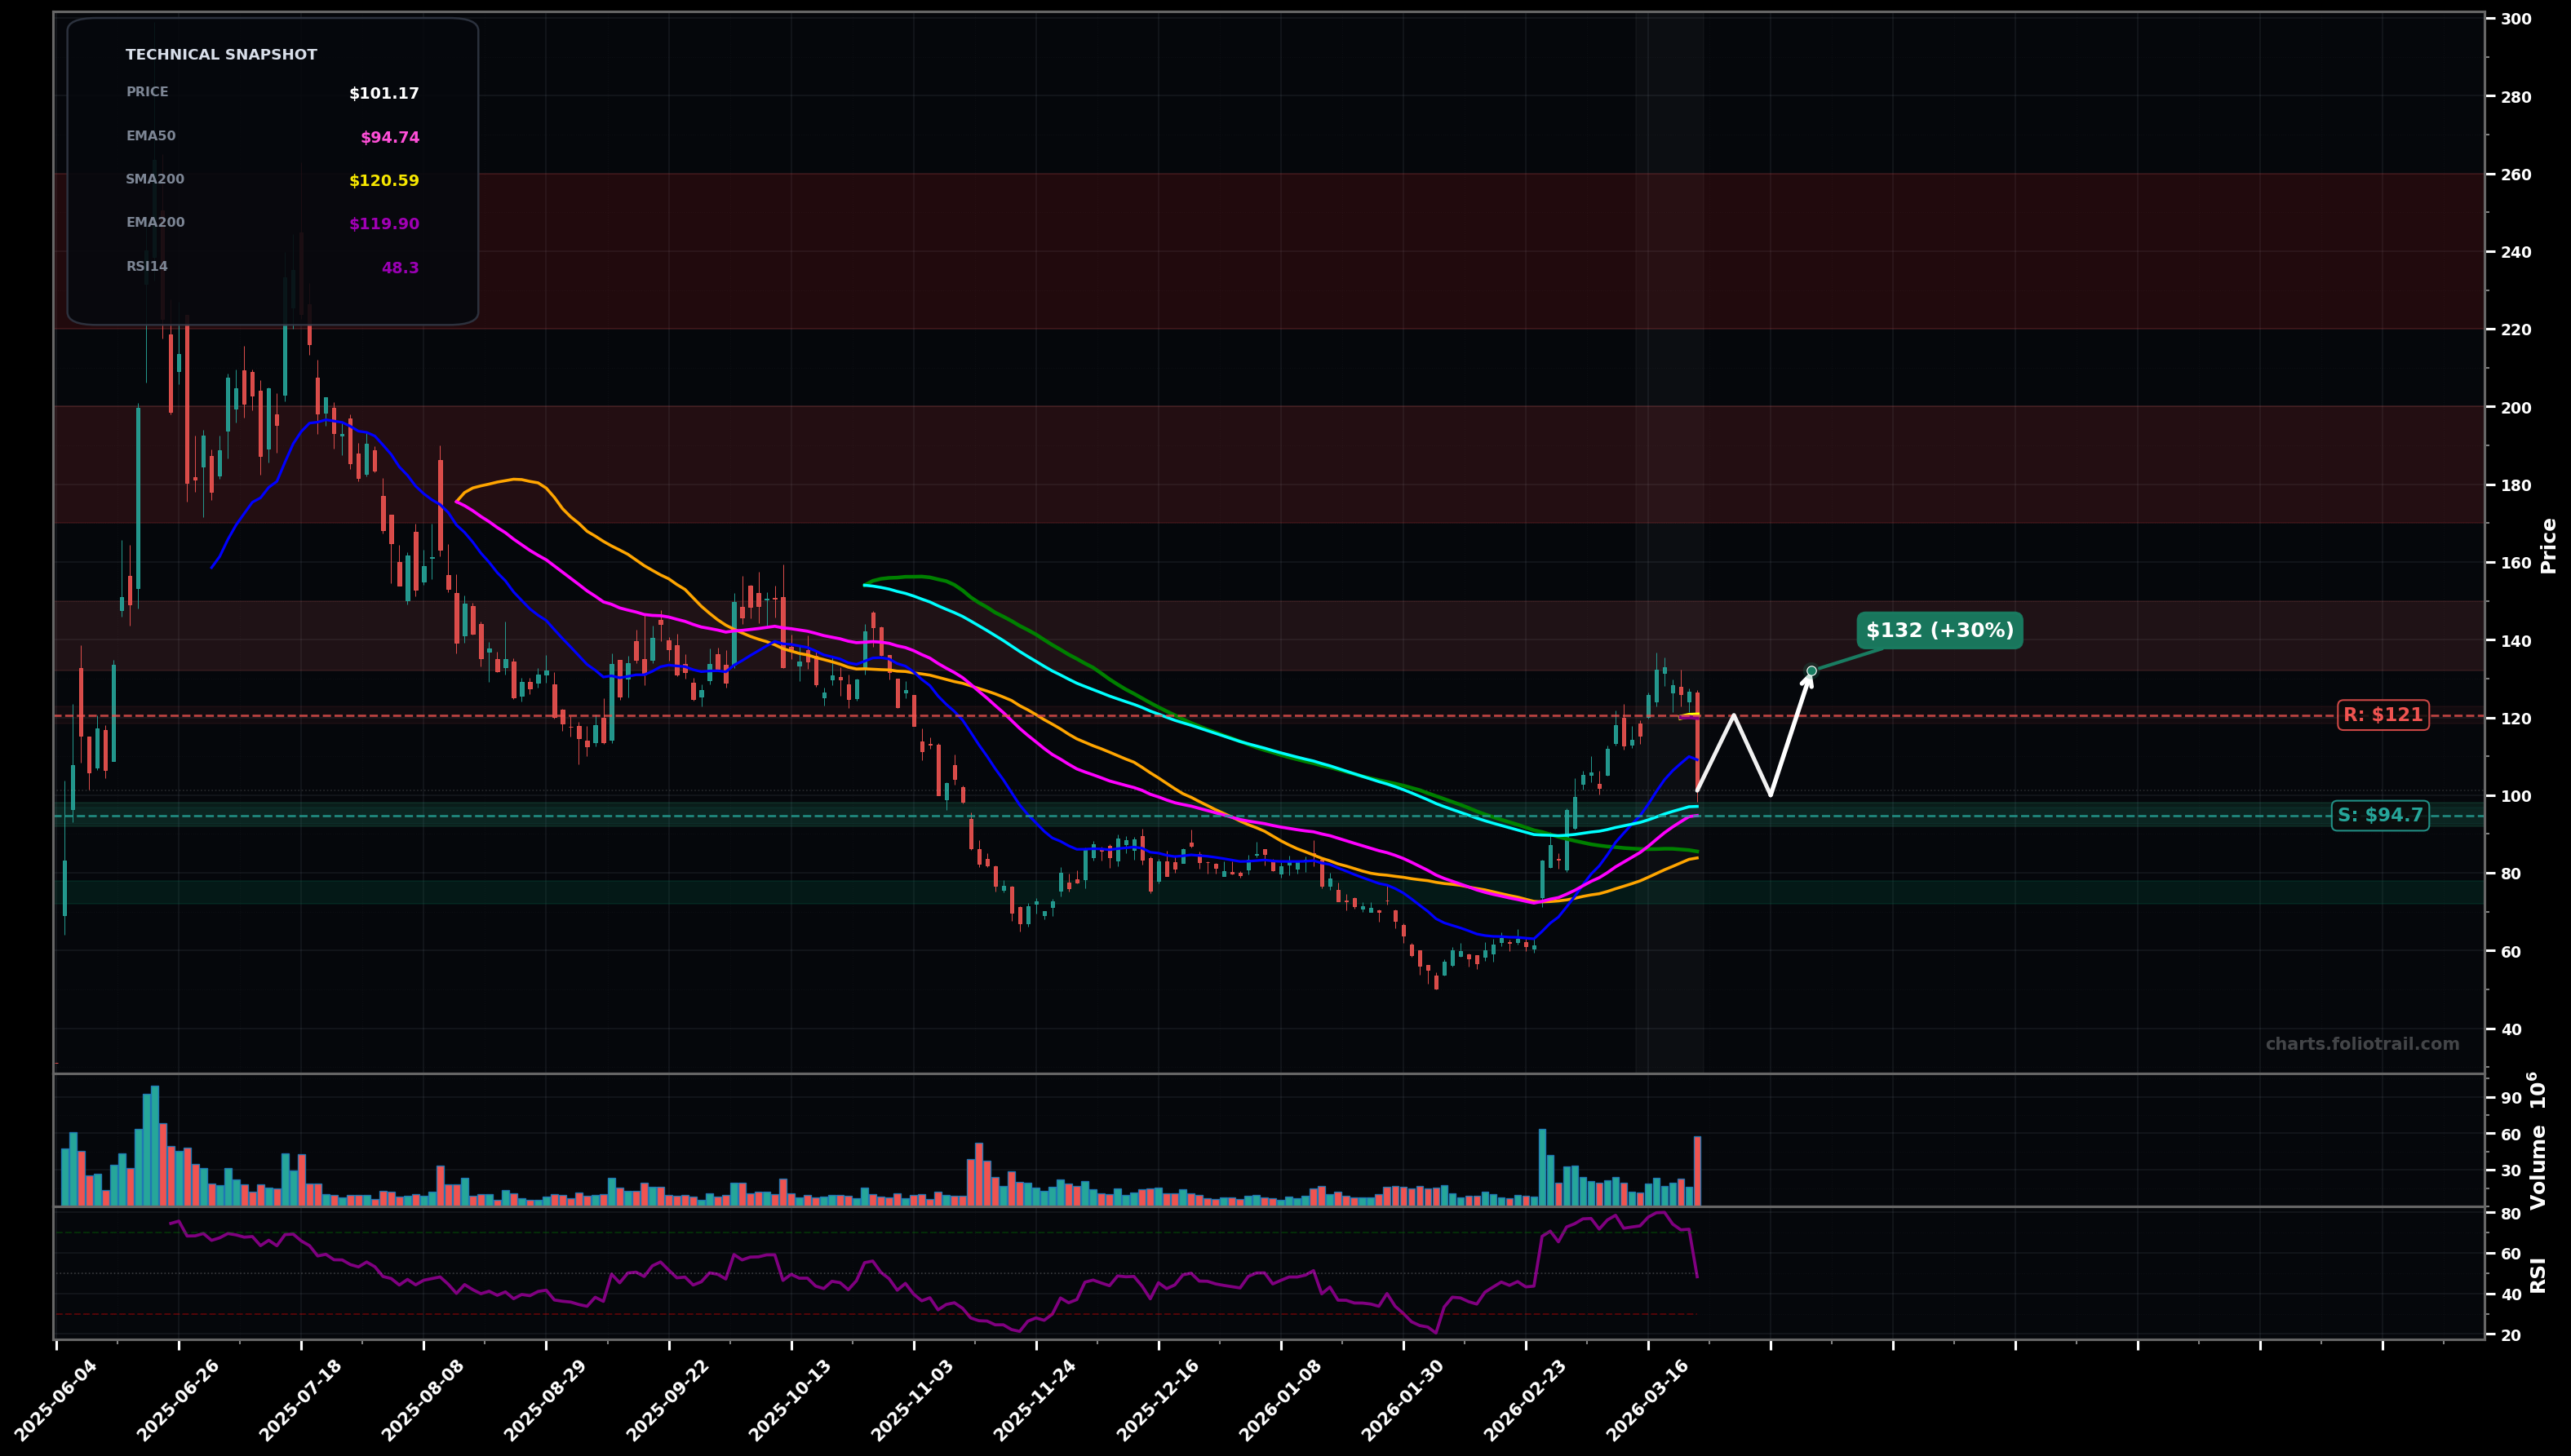
As of March 25, 2026, CRCL (Circle Internet Group, Inc.) is in a bottoming attempt state on the daily chart, with a confidence level of 62%. Key support is at $94.7 and key resistance at $121. Strong rally from the $60s into the $130s, then sharp pullback; now ~$101 sitting near the rising EMA50 (~$95) but still below EMA200/SMA200 (~$120).
Bullish consolidation above EMA50/EMA100, then another push to retest the $120–$130 supply zone; if absorbed, continuation toward prior swing high area.
Failed retest: price loses EMA50/EMA100, turns the move into a corrective bounce, and mean-reverts toward the prior breakout base/support band.
2+ daily closes above $120.60 (SMA200) with follow-through
Daily close below $94.70 (EMA50) and especially a break below $90.00
Start near EMA50/EMA100 confluence, add on breakdown-to-support retest near $90, heavy add at deeper Fib-style retrace toward prior base ($75 area) if market-wide risk-off hits.
Trim into overhead MA/supply then prior distribution zones; progressively de-risk if price becomes extended far above rising EMA50 and into prior high-volume rejection areas.
As of March 25, 2026, CRCL (Circle Internet Group, Inc.) is in a bottoming attempt state on the daily chart with 62% confidence. Strong rally from the $60s into the $130s, then sharp pullback; now ~$101 sitting near the rising EMA50 (~$95) but still below EMA200/SMA200 (~$120).
On the daily timeframe, CRCL has key support at $94.7 and key resistance at $121. The most likely scenario (bullish) targets $121 and $132, with a revert level at $100.
CRCL (Circle Internet Group, Inc.) is currently classified as bottoming attempt on the daily chart, with 62% confidence. Confirmation requires: 2+ daily closes above $120.60 (SMA200) with follow-through This would be invalidated by: Daily close below $94.70 (EMA50) and especially a break below $90.00
The most likely scenario (bullish) targets $121 and $132, with a revert level at $100. The alternative scenario (bearish) targets $90.0 and $75.0.
Multi-layer AI agents analyse 200+ stocks across daily, weekly, and monthly timeframes — producing market state classifications, price scenarios with targets, and position entry/exit levels. Updated every trading day after market close. No paywall. No sign-up required.
Built by Foliotrail.
All content on this website — including charts, analysis, price targets, support/resistance levels, and position zones — is generated entirely by AI and provided for educational and informational purposes only.
This is not financial advice. NEXUSNOIR VENTURES SL (the operator of this website) is not a registered investment adviser or broker-dealer. You should not make investment decisions based solely on this information. Always do your own research and consult a qualified financial advisor.
By continuing, you acknowledge that you have read and agree to our full disclaimer & terms of use and privacy policy.