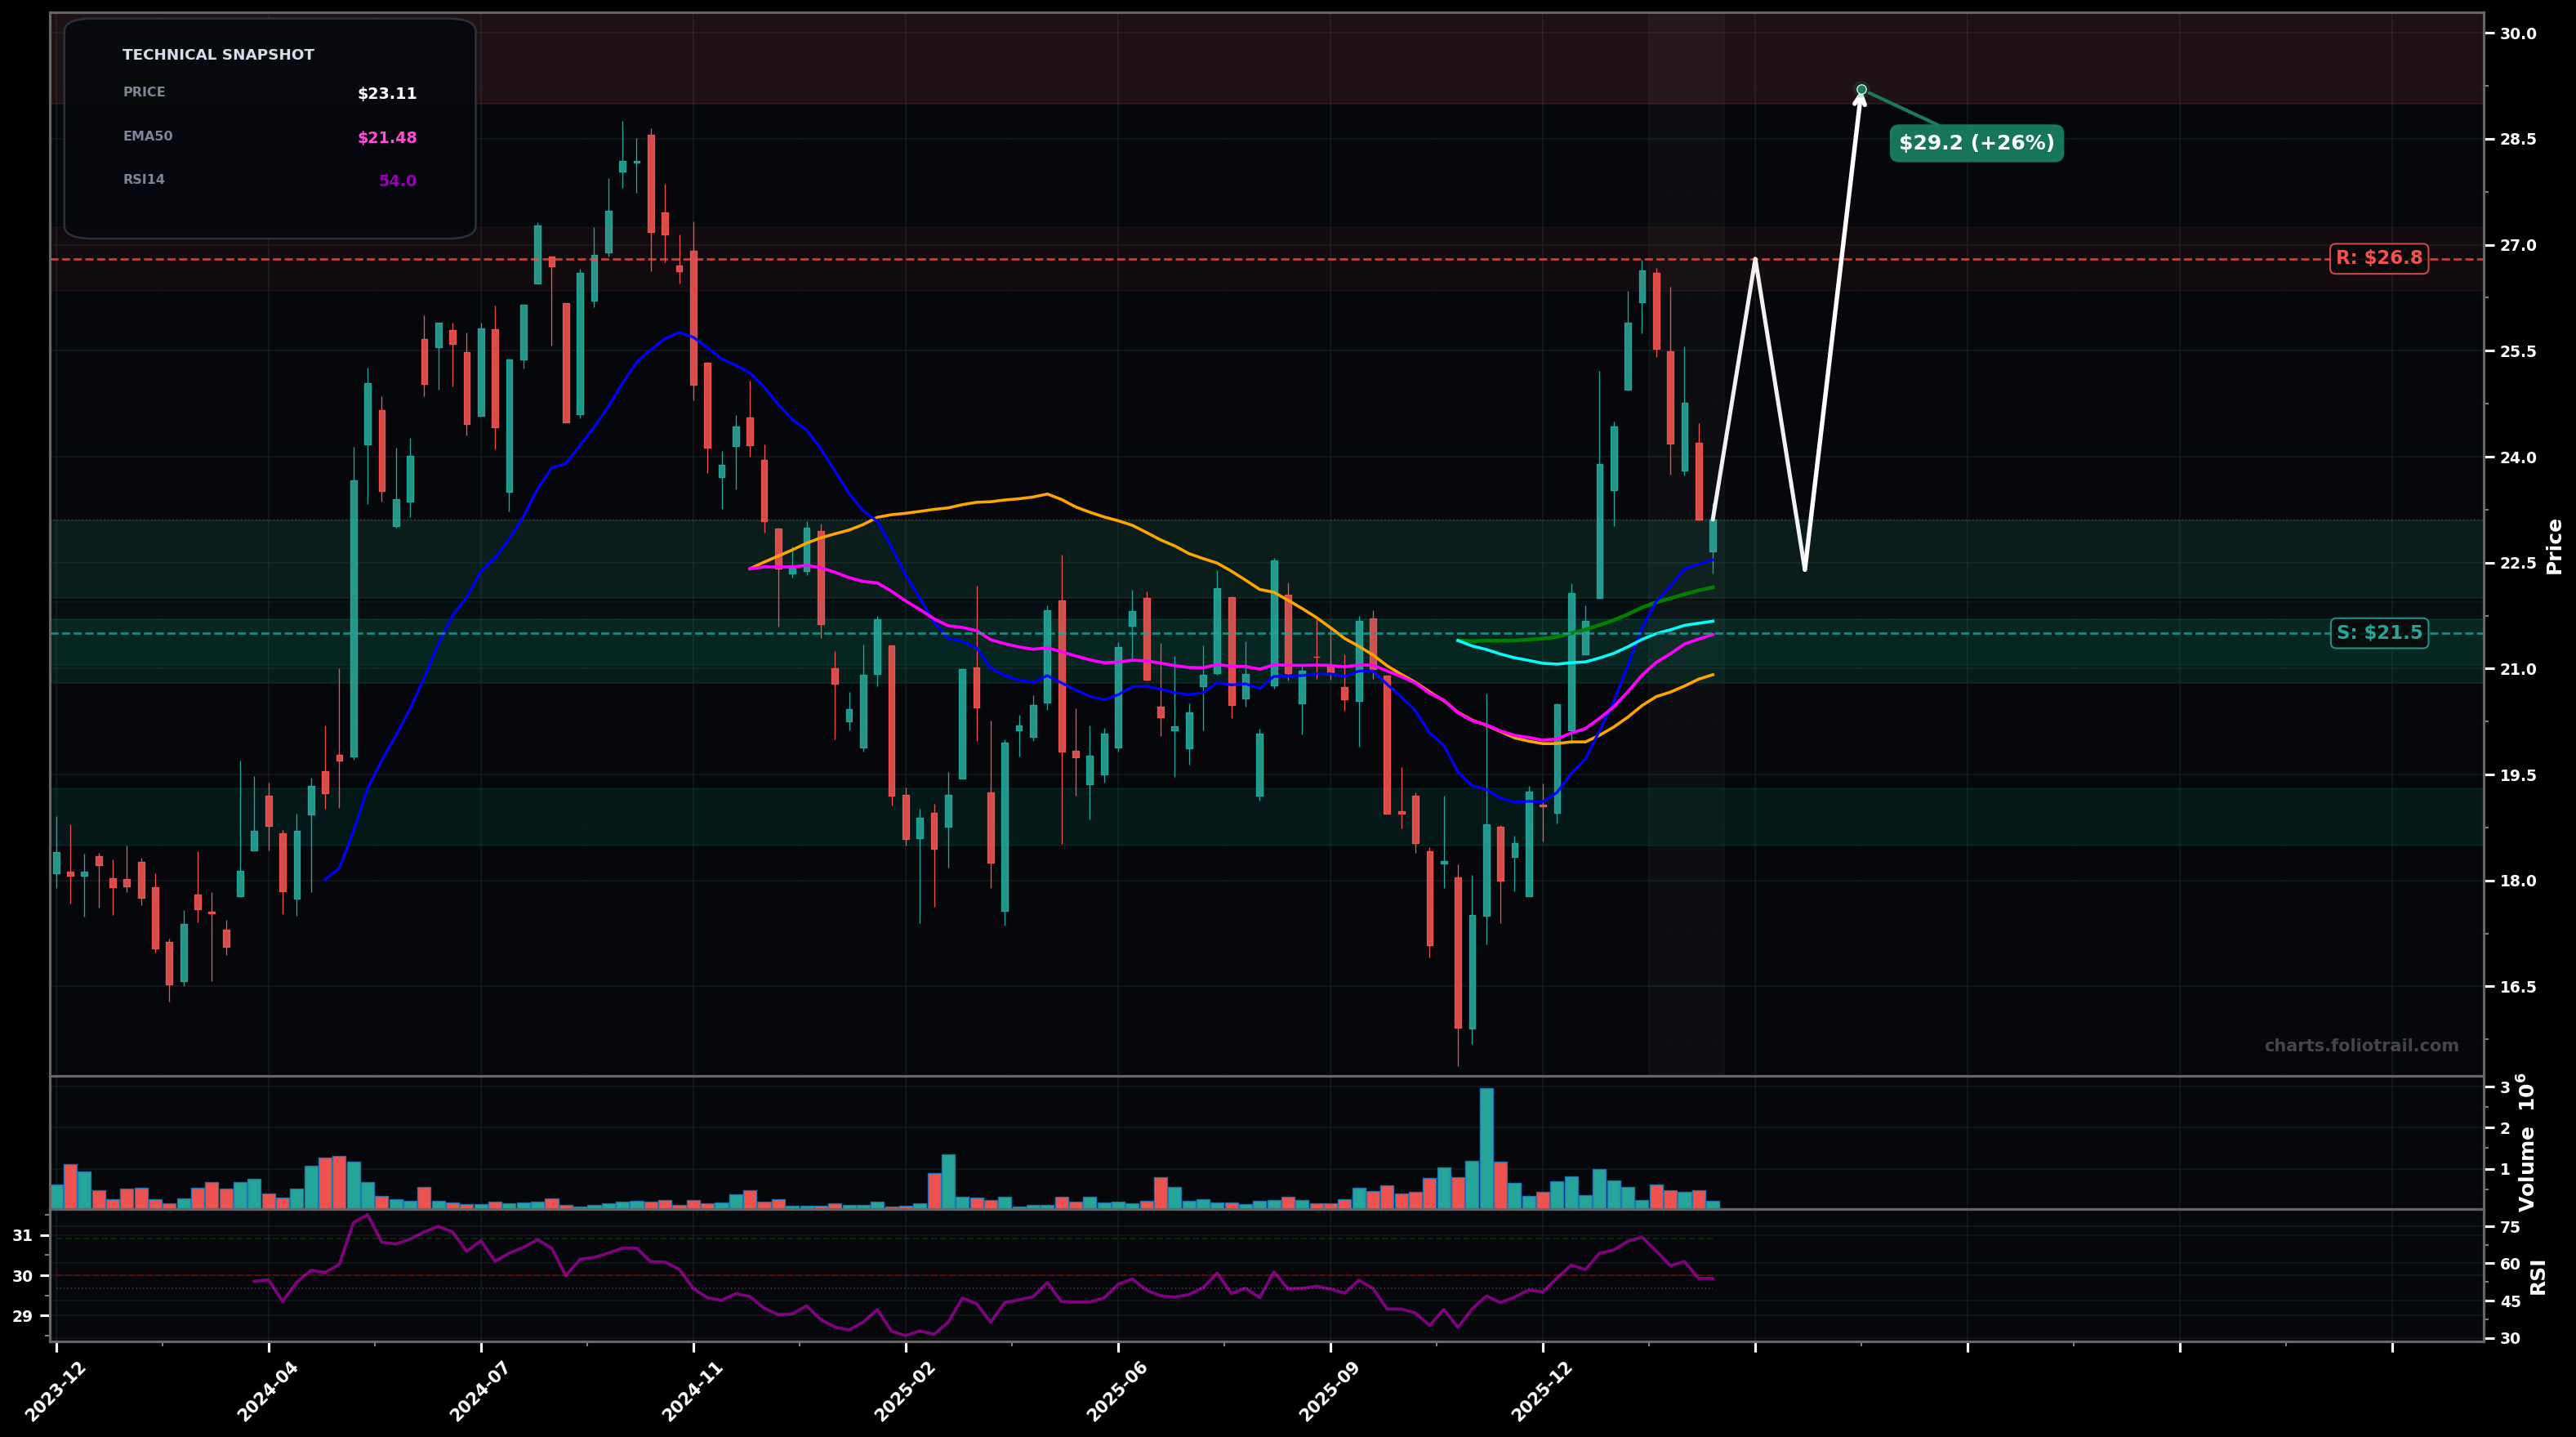
As of March 25, 2026, CDLR (Cadeler A/S) is in a bottoming attempt state on the weekly chart, with a confidence level of 58%. Key support is at $21.5 and key resistance at $26.8. Sharp rally from the $16s to $26-$27 followed by a pullback to $23 area; price still holding above key rising short/mid MAs while RSI cooled to mid-50s.
Bullish continuation after a controlled pullback: price consolidates above the EMA50/EMA100 cluster ($21.5-$22.5) then attempts a retest of the $26-$27 swing high; if broken, extension toward the next Fibonacci zone.
Deeper mean-reversion: pullback slips under the short/mid EMA cluster and re-tests the breakout base around the low $20s; this would fit an Elliott Wave ABC correction after an impulsive 1-2-3 move off the lows.
Weekly close above $26.80 with follow-through (2+ weekly closes holding >$26.80).
Weekly close below $21.50 (loss of EMA cluster + prior breakout zone).
Start near current pullback support/EMA50 area; add on a clean retest of the reclaimed MA cluster/previous range top; heavy add only if a deeper fib-style retrace revisits the prior base (but above the major low).
Trim into likely fib extensions above the $26-$27 swing high where price would be stretched vs rising MAs; heavier trims as extensions accelerate and distance to EMA50/100 widens.
As of March 25, 2026, CDLR (Cadeler A/S) is in a bottoming attempt state on the weekly chart with 58% confidence. Sharp rally from the $16s to $26-$27 followed by a pullback to $23 area; price still holding above key rising short/mid MAs while RSI cooled to mid-50s.
On the weekly timeframe, CDLR has key support at $21.5 and key resistance at $26.8. The most likely scenario (bullish) targets $26.8 and $29.2, with a revert level at $22.4.
CDLR (Cadeler A/S) is currently classified as bottoming attempt on the weekly chart, with 58% confidence. Confirmation requires: Weekly close above $26.80 with follow-through (2+ weekly closes holding >$26.80). This would be invalidated by: Weekly close below $21.50 (loss of EMA cluster + prior breakout zone).
The most likely scenario (bullish) targets $26.8 and $29.2, with a revert level at $22.4. The alternative scenario (bearish) targets $21.0 and $18.8.
Multi-layer AI agents analyse 200+ stocks across daily, weekly, and monthly timeframes — producing market state classifications, price scenarios with targets, and position entry/exit levels. Updated every trading day after market close. No paywall. No sign-up required.
Built by Foliotrail.
All content on this website — including charts, analysis, price targets, support/resistance levels, and position zones — is generated entirely by AI and provided for educational and informational purposes only.
This is not financial advice. NEXUSNOIR VENTURES SL (the operator of this website) is not a registered investment adviser or broker-dealer. You should not make investment decisions based solely on this information. Always do your own research and consult a qualified financial advisor.
By continuing, you acknowledge that you have read and agree to our full disclaimer & terms of use and privacy policy.