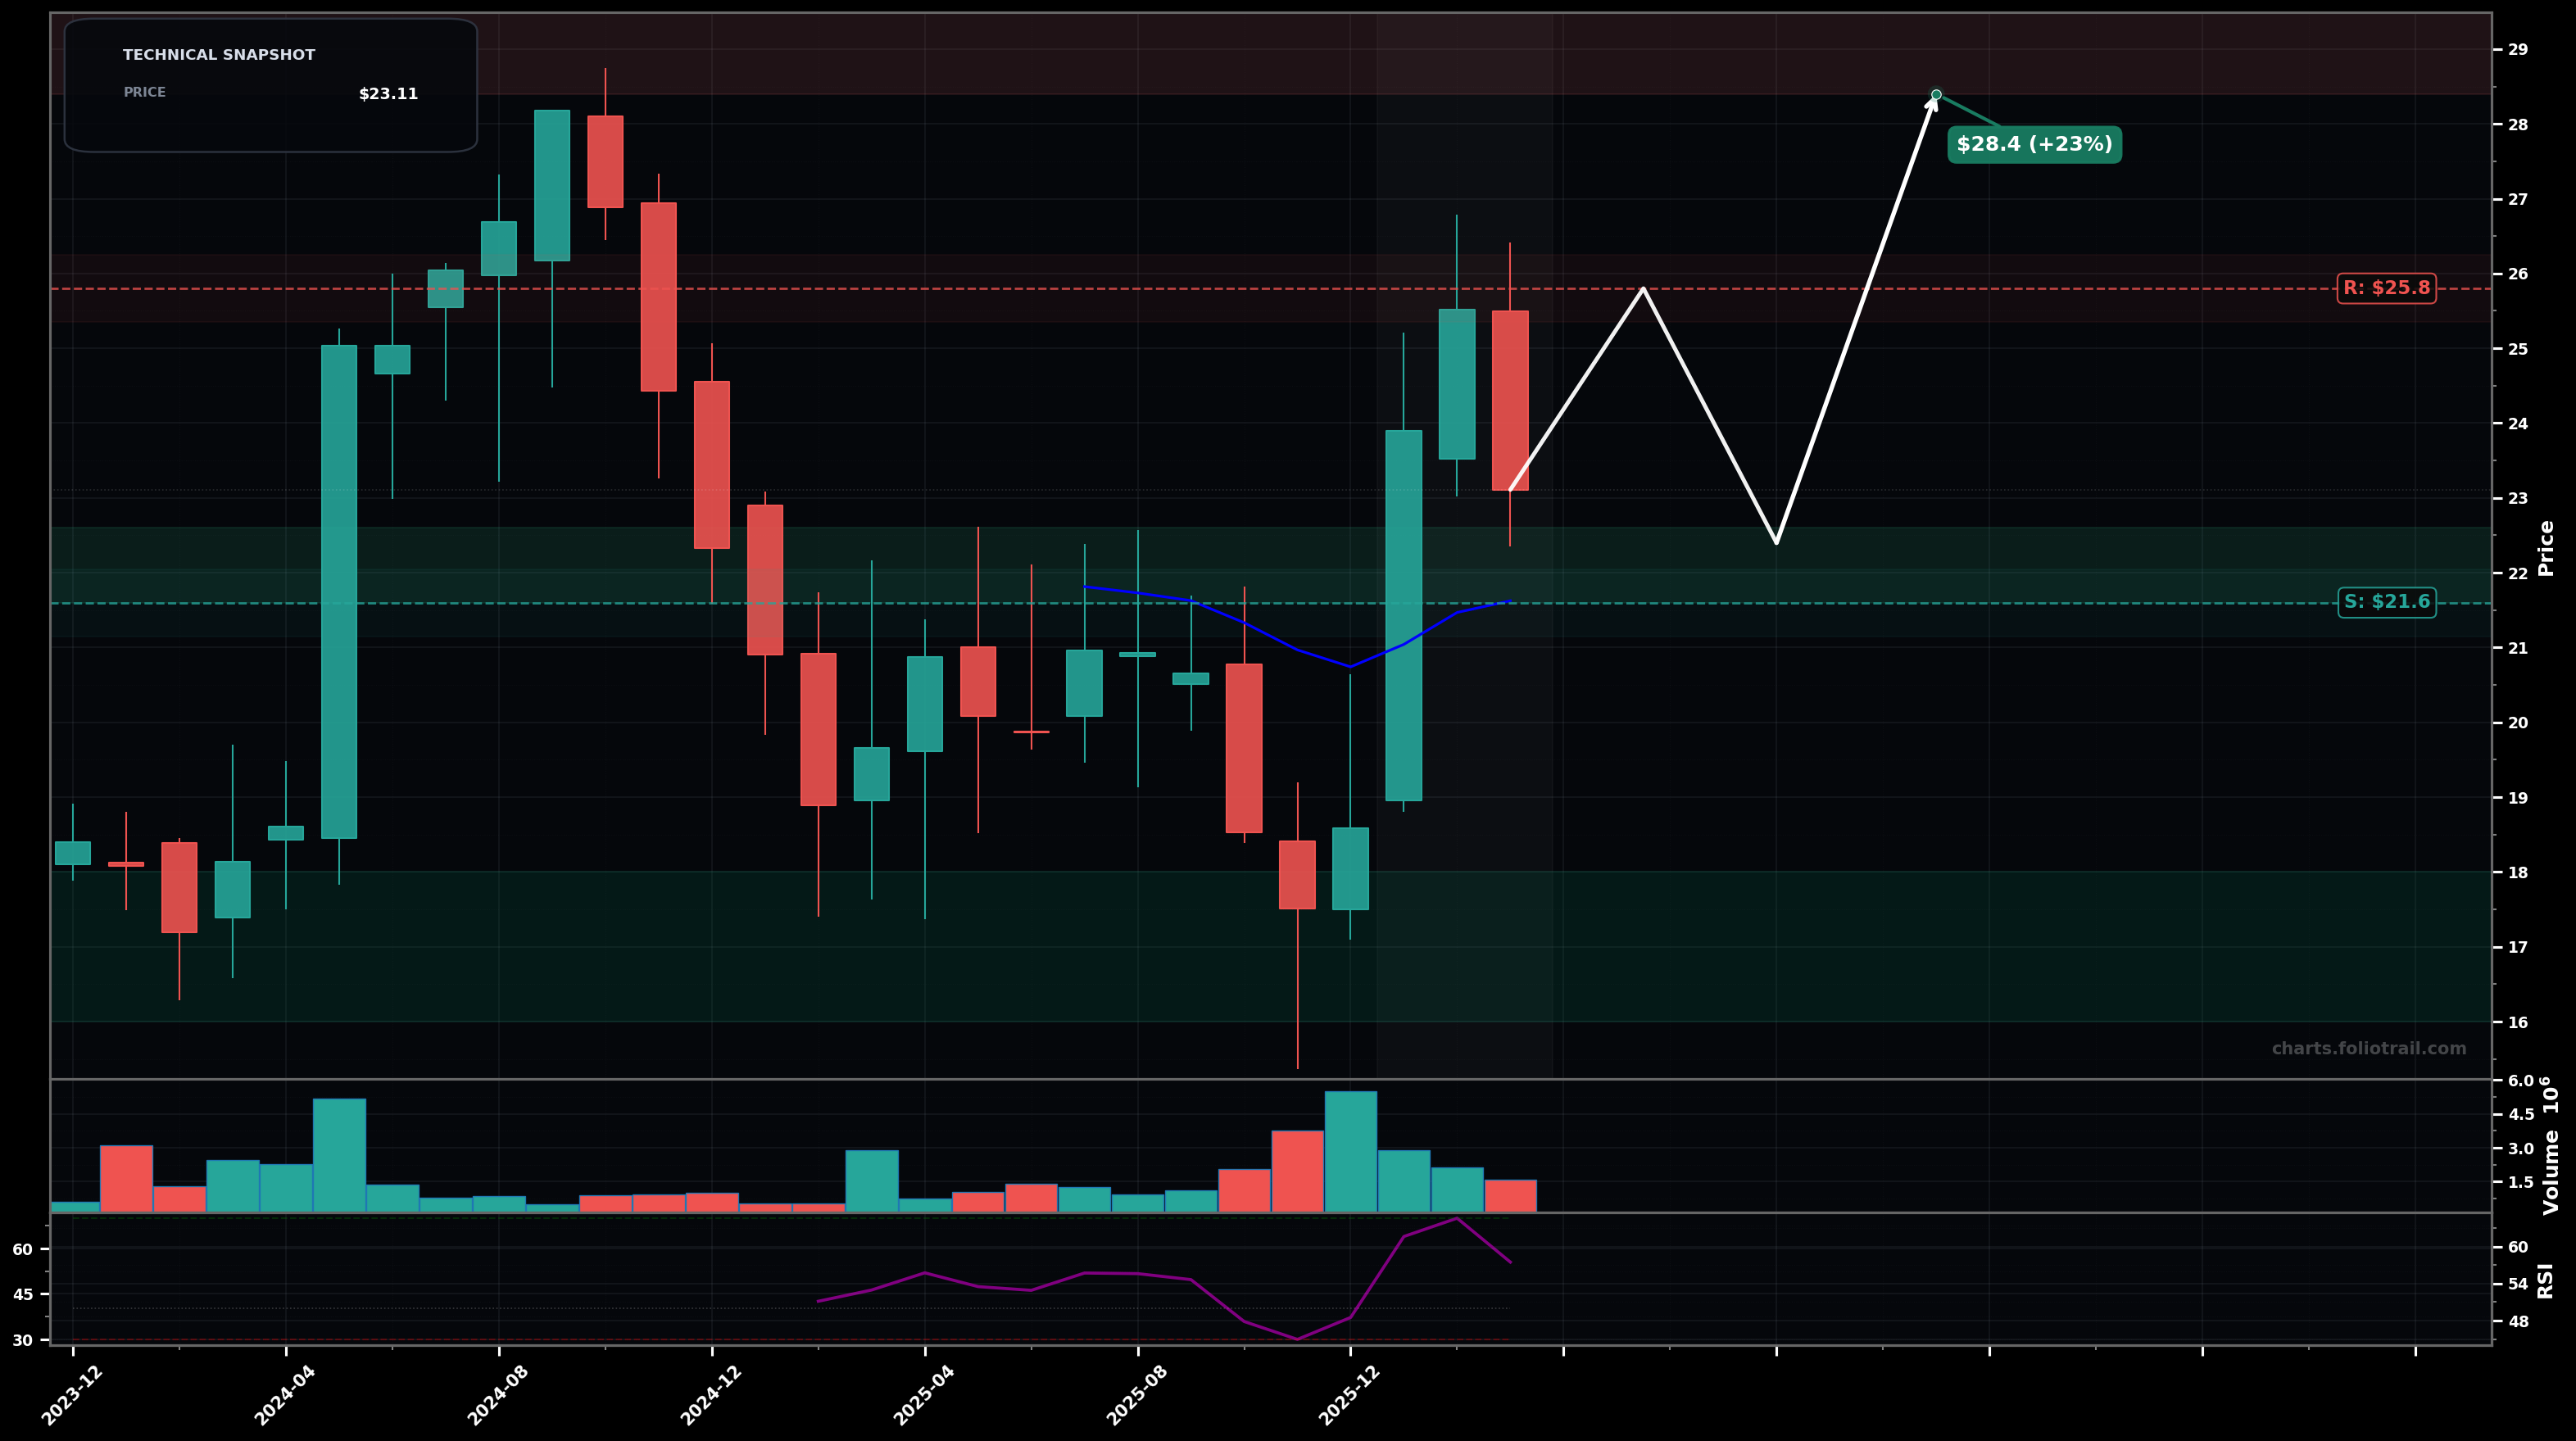
As of March 25, 2026, CDLR (Cadeler A/S) is in a bottoming attempt state on the monthly chart, with a confidence level of 63%. Key support is at $21.6 and key resistance at $25.8. Monthly pullback after a sharp rebound from the ~$16 swing low; latest candle is a red rejection from the ~$25-26 area while still holding above the rising short-term trend line/EMA20 (~$21.63).
Base holds above ~$21.6; price digests the recent pop and then attempts a second push to retest/break the ~$25.8 supply, targeting a measured move into the high-$20s (Elliott: rebound as Wave (1), pullback as Wave (2), next advance as Wave (3) attempt).
Rejection from ~$25-26 turns into a deeper retrace (Fibonacci-style 50%+ of the rebound) back into the ~$20 area; if that fails, a retest of the ~$16 swing low becomes likely (bearish ABC correction).
Monthly close > $25.80 (break/hold above the prior swing high supply zone)
Monthly close < $21.60 (loss of EMA20 and last consolidation floor)
Start near EMA20/structure support, add on deeper Fib retrace into prior base, heavy add only near the major swing-low demand (~$16-18) where bottoming would be most defensible.
Trim into prior-cycle supply and likely Fib extension zones from the ~$16->$26 leg; fully close if price becomes multi-year stretched vs the base (parabolic risk/mean reversion).
As of March 25, 2026, CDLR (Cadeler A/S) is in a bottoming attempt state on the monthly chart with 63% confidence. Monthly pullback after a sharp rebound from the ~$16 swing low; latest candle is a red rejection from the ~$25-26 area while still holding above the rising short-term trend line/EMA20 (~$21.63).
On the monthly timeframe, CDLR has key support at $21.6 and key resistance at $25.8. The most likely scenario (bullish) targets $25.8 and $28.4, with a revert level at $22.4.
CDLR (Cadeler A/S) is currently classified as bottoming attempt on the monthly chart, with 63% confidence. Confirmation requires: Monthly close > $25.80 (break/hold above the prior swing high supply zone) This would be invalidated by: Monthly close < $21.60 (loss of EMA20 and last consolidation floor)
The most likely scenario (bullish) targets $25.8 and $28.4, with a revert level at $22.4. The alternative scenario (bearish) targets $20.2 and $16.2.
Multi-layer AI agents analyse 200+ stocks across daily, weekly, and monthly timeframes — producing market state classifications, price scenarios with targets, and position entry/exit levels. Updated every trading day after market close. No paywall. No sign-up required.
Built by Foliotrail.
All content on this website — including charts, analysis, price targets, support/resistance levels, and position zones — is generated entirely by AI and provided for educational and informational purposes only.
This is not financial advice. NEXUSNOIR VENTURES SL (the operator of this website) is not a registered investment adviser or broker-dealer. You should not make investment decisions based solely on this information. Always do your own research and consult a qualified financial advisor.
By continuing, you acknowledge that you have read and agree to our full disclaimer & terms of use and privacy policy.