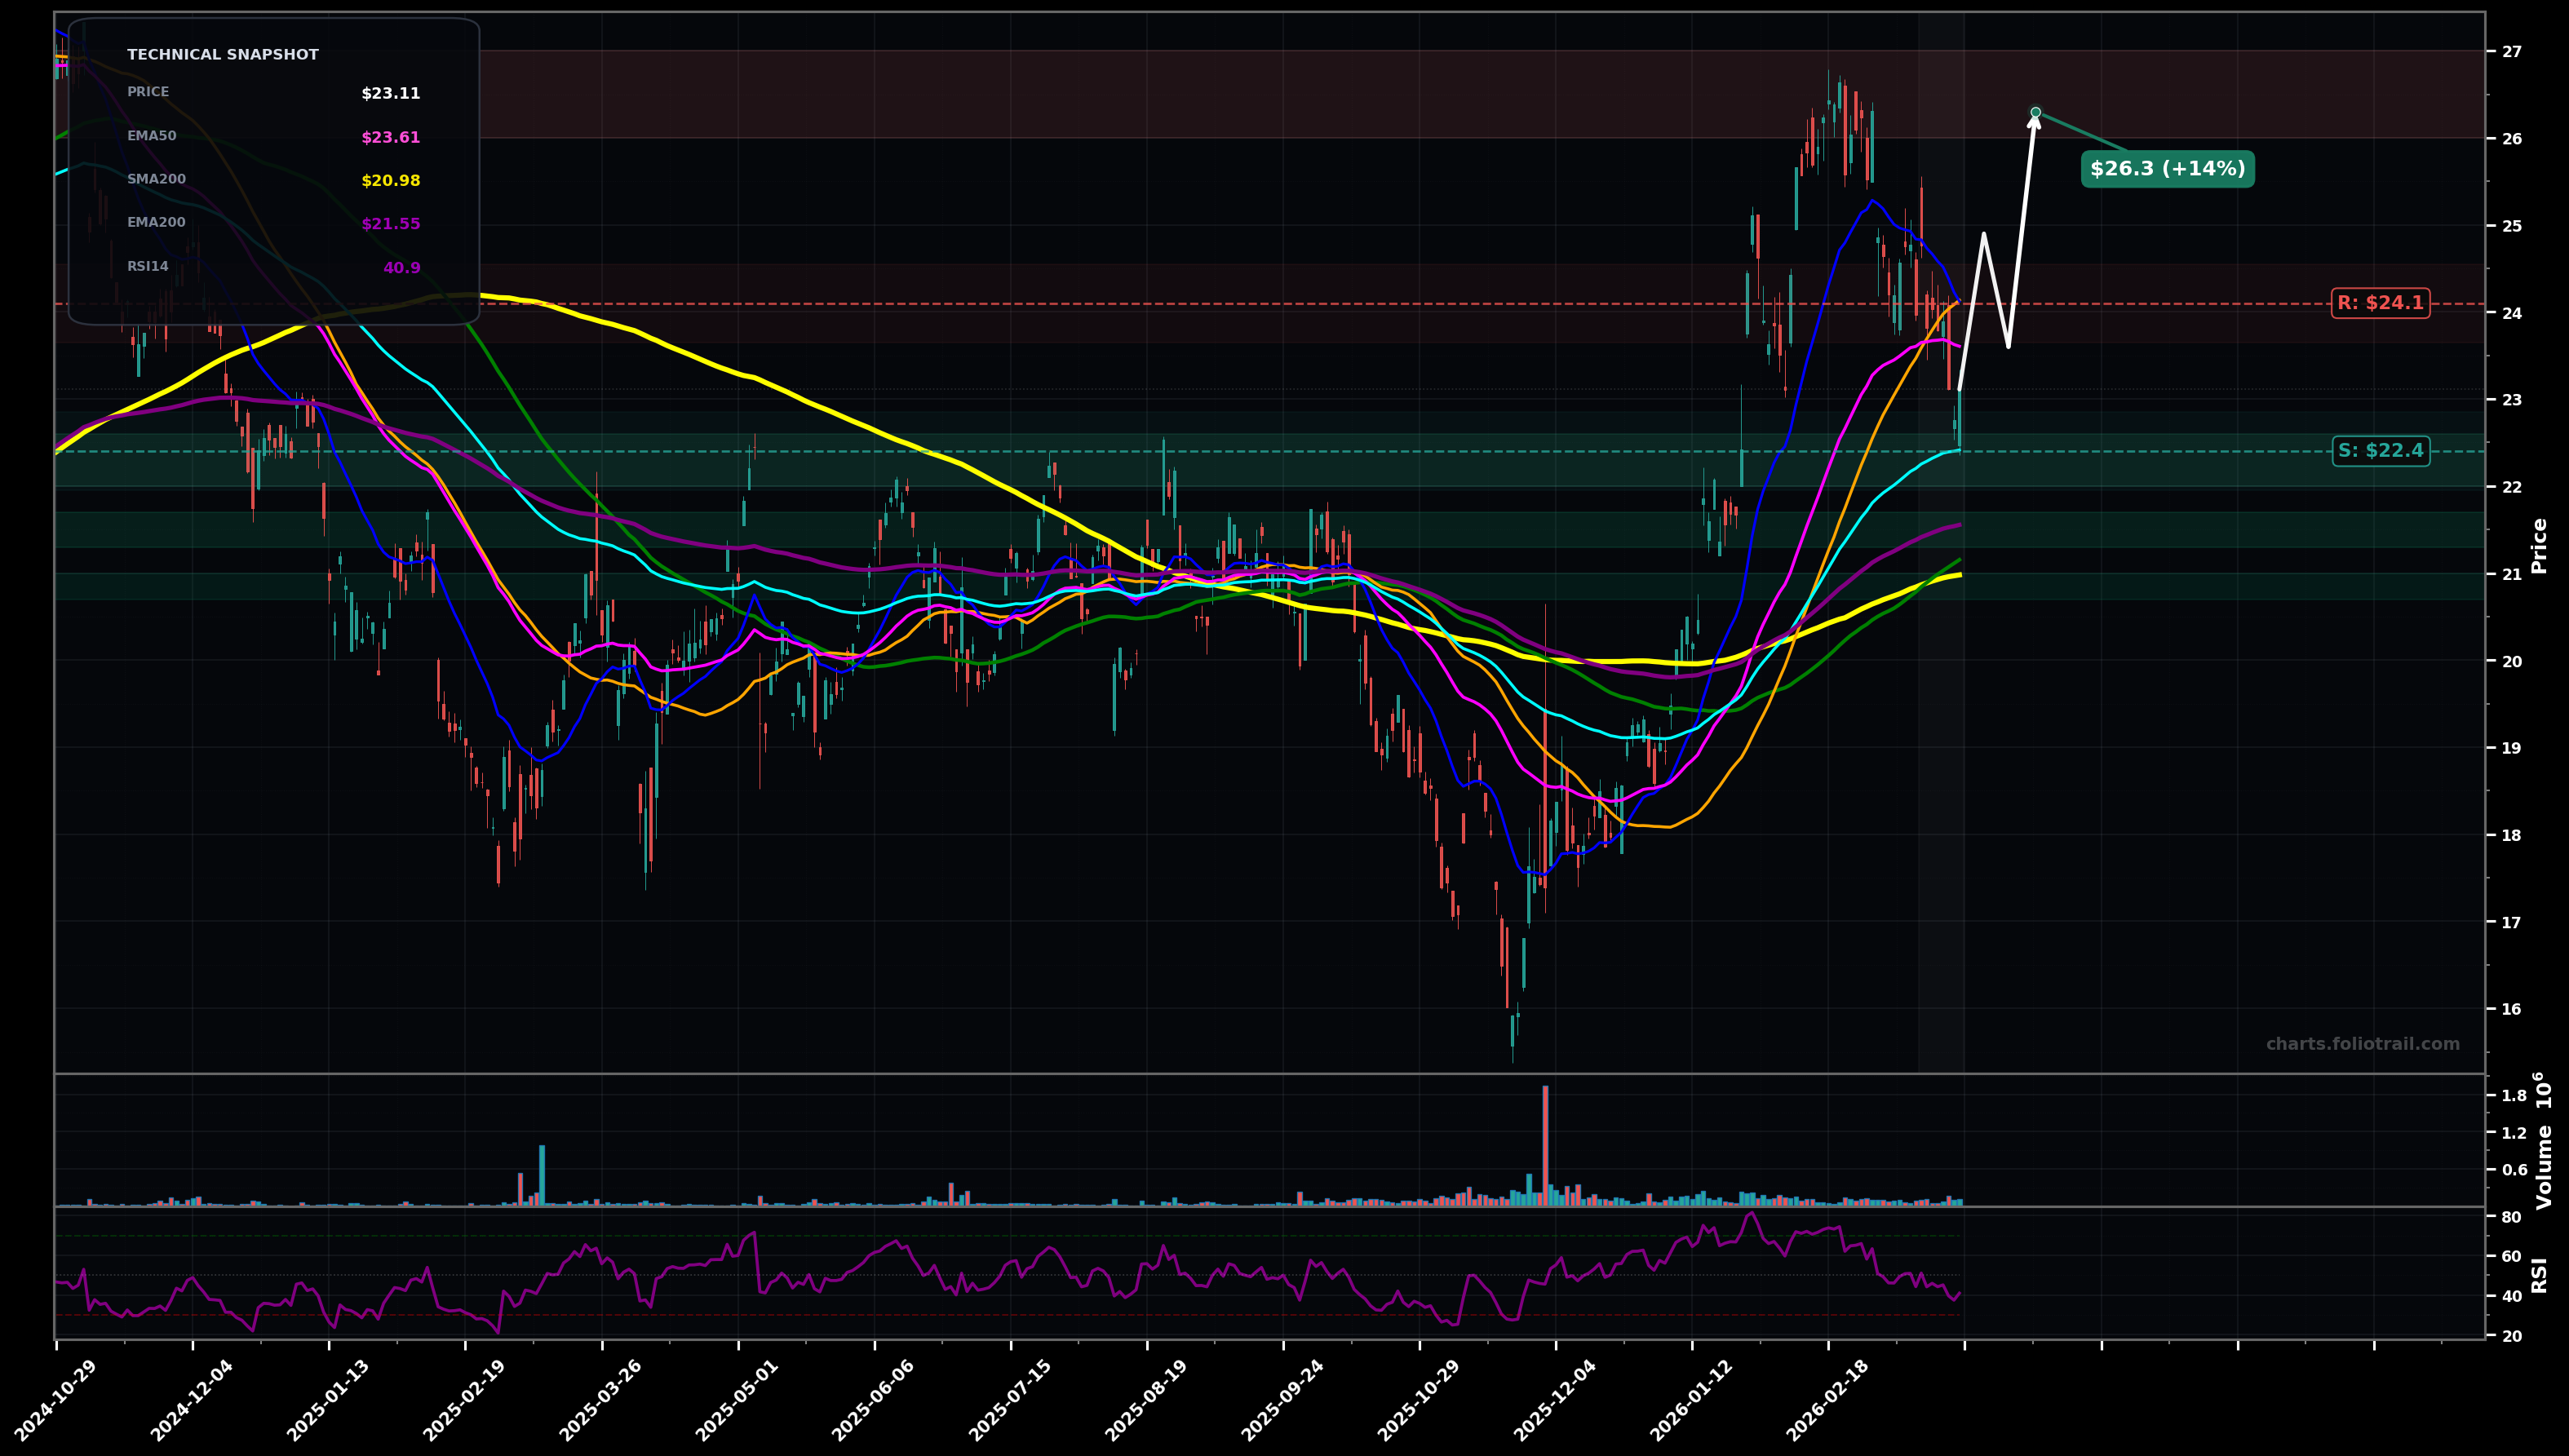
As of March 25, 2026, CDLR (Cadeler A/S) is in a choppy range state on the daily chart, with a confidence level of 58%. Key support is at $22.4 and key resistance at $24.1. Pulled back from the ~$26-$27 swing high into the $23 area; price is sitting just below the EMA50 (~$23.61) while still above the rising EMA100 (~$22.41).
Bullish base-and-reclaim: holds $22.40-$22.00, reclaims EMA50, then pushes into prior supply near the breakdown area and retests the recent swing high zone (Elliott: Wave 4 consolidation then Wave 5 attempt).
Bearish continuation of the correction: loses EMA100 and mean-reverts toward EMA200/major MA cluster; this fits a deeper Wave 4 (or larger degree ABC) retracement before any renewed uptrend.
2+ daily closes back above $23.60 (EMA50) and holding above $24.10
Daily close below $22.40 (EMA100) with follow-through
Start near EMA100/support, add near EMA200 (~$21.55), heavy add at SMA200/major base support (~$20.95) assuming no heavy breakdown candle sequence.
Trim into prior swing-high supply ($26-$27); heavier trims if price becomes extended well above rising MAs; full exit only on a multi-year stretch/mania-type extension beyond prior peak structure.
As of March 25, 2026, CDLR (Cadeler A/S) is in a choppy range state on the daily chart with 58% confidence. Pulled back from the ~$26-$27 swing high into the $23 area; price is sitting just below the EMA50 (~$23.61) while still above the rising EMA100 (~$22.41).
On the daily timeframe, CDLR has key support at $22.4 and key resistance at $24.1. The most likely scenario (bullish) targets $24.9 and $26.3, with a revert level at $23.6.
CDLR (Cadeler A/S) is currently classified as choppy range on the daily chart, with 58% confidence. Confirmation requires: 2+ daily closes back above $23.60 (EMA50) and holding above $24.10 This would be invalidated by: Daily close below $22.40 (EMA100) with follow-through
The most likely scenario (bullish) targets $24.9 and $26.3, with a revert level at $23.6. The alternative scenario (bearish) targets $21.6 and $20.9.
Multi-layer AI agents analyse 200+ stocks across daily, weekly, and monthly timeframes — producing market state classifications, price scenarios with targets, and position entry/exit levels. Updated every trading day after market close. No paywall. No sign-up required.
Built by Foliotrail.
All content on this website — including charts, analysis, price targets, support/resistance levels, and position zones — is generated entirely by AI and provided for educational and informational purposes only.
This is not financial advice. NEXUSNOIR VENTURES SL (the operator of this website) is not a registered investment adviser or broker-dealer. You should not make investment decisions based solely on this information. Always do your own research and consult a qualified financial advisor.
By continuing, you acknowledge that you have read and agree to our full disclaimer & terms of use and privacy policy.