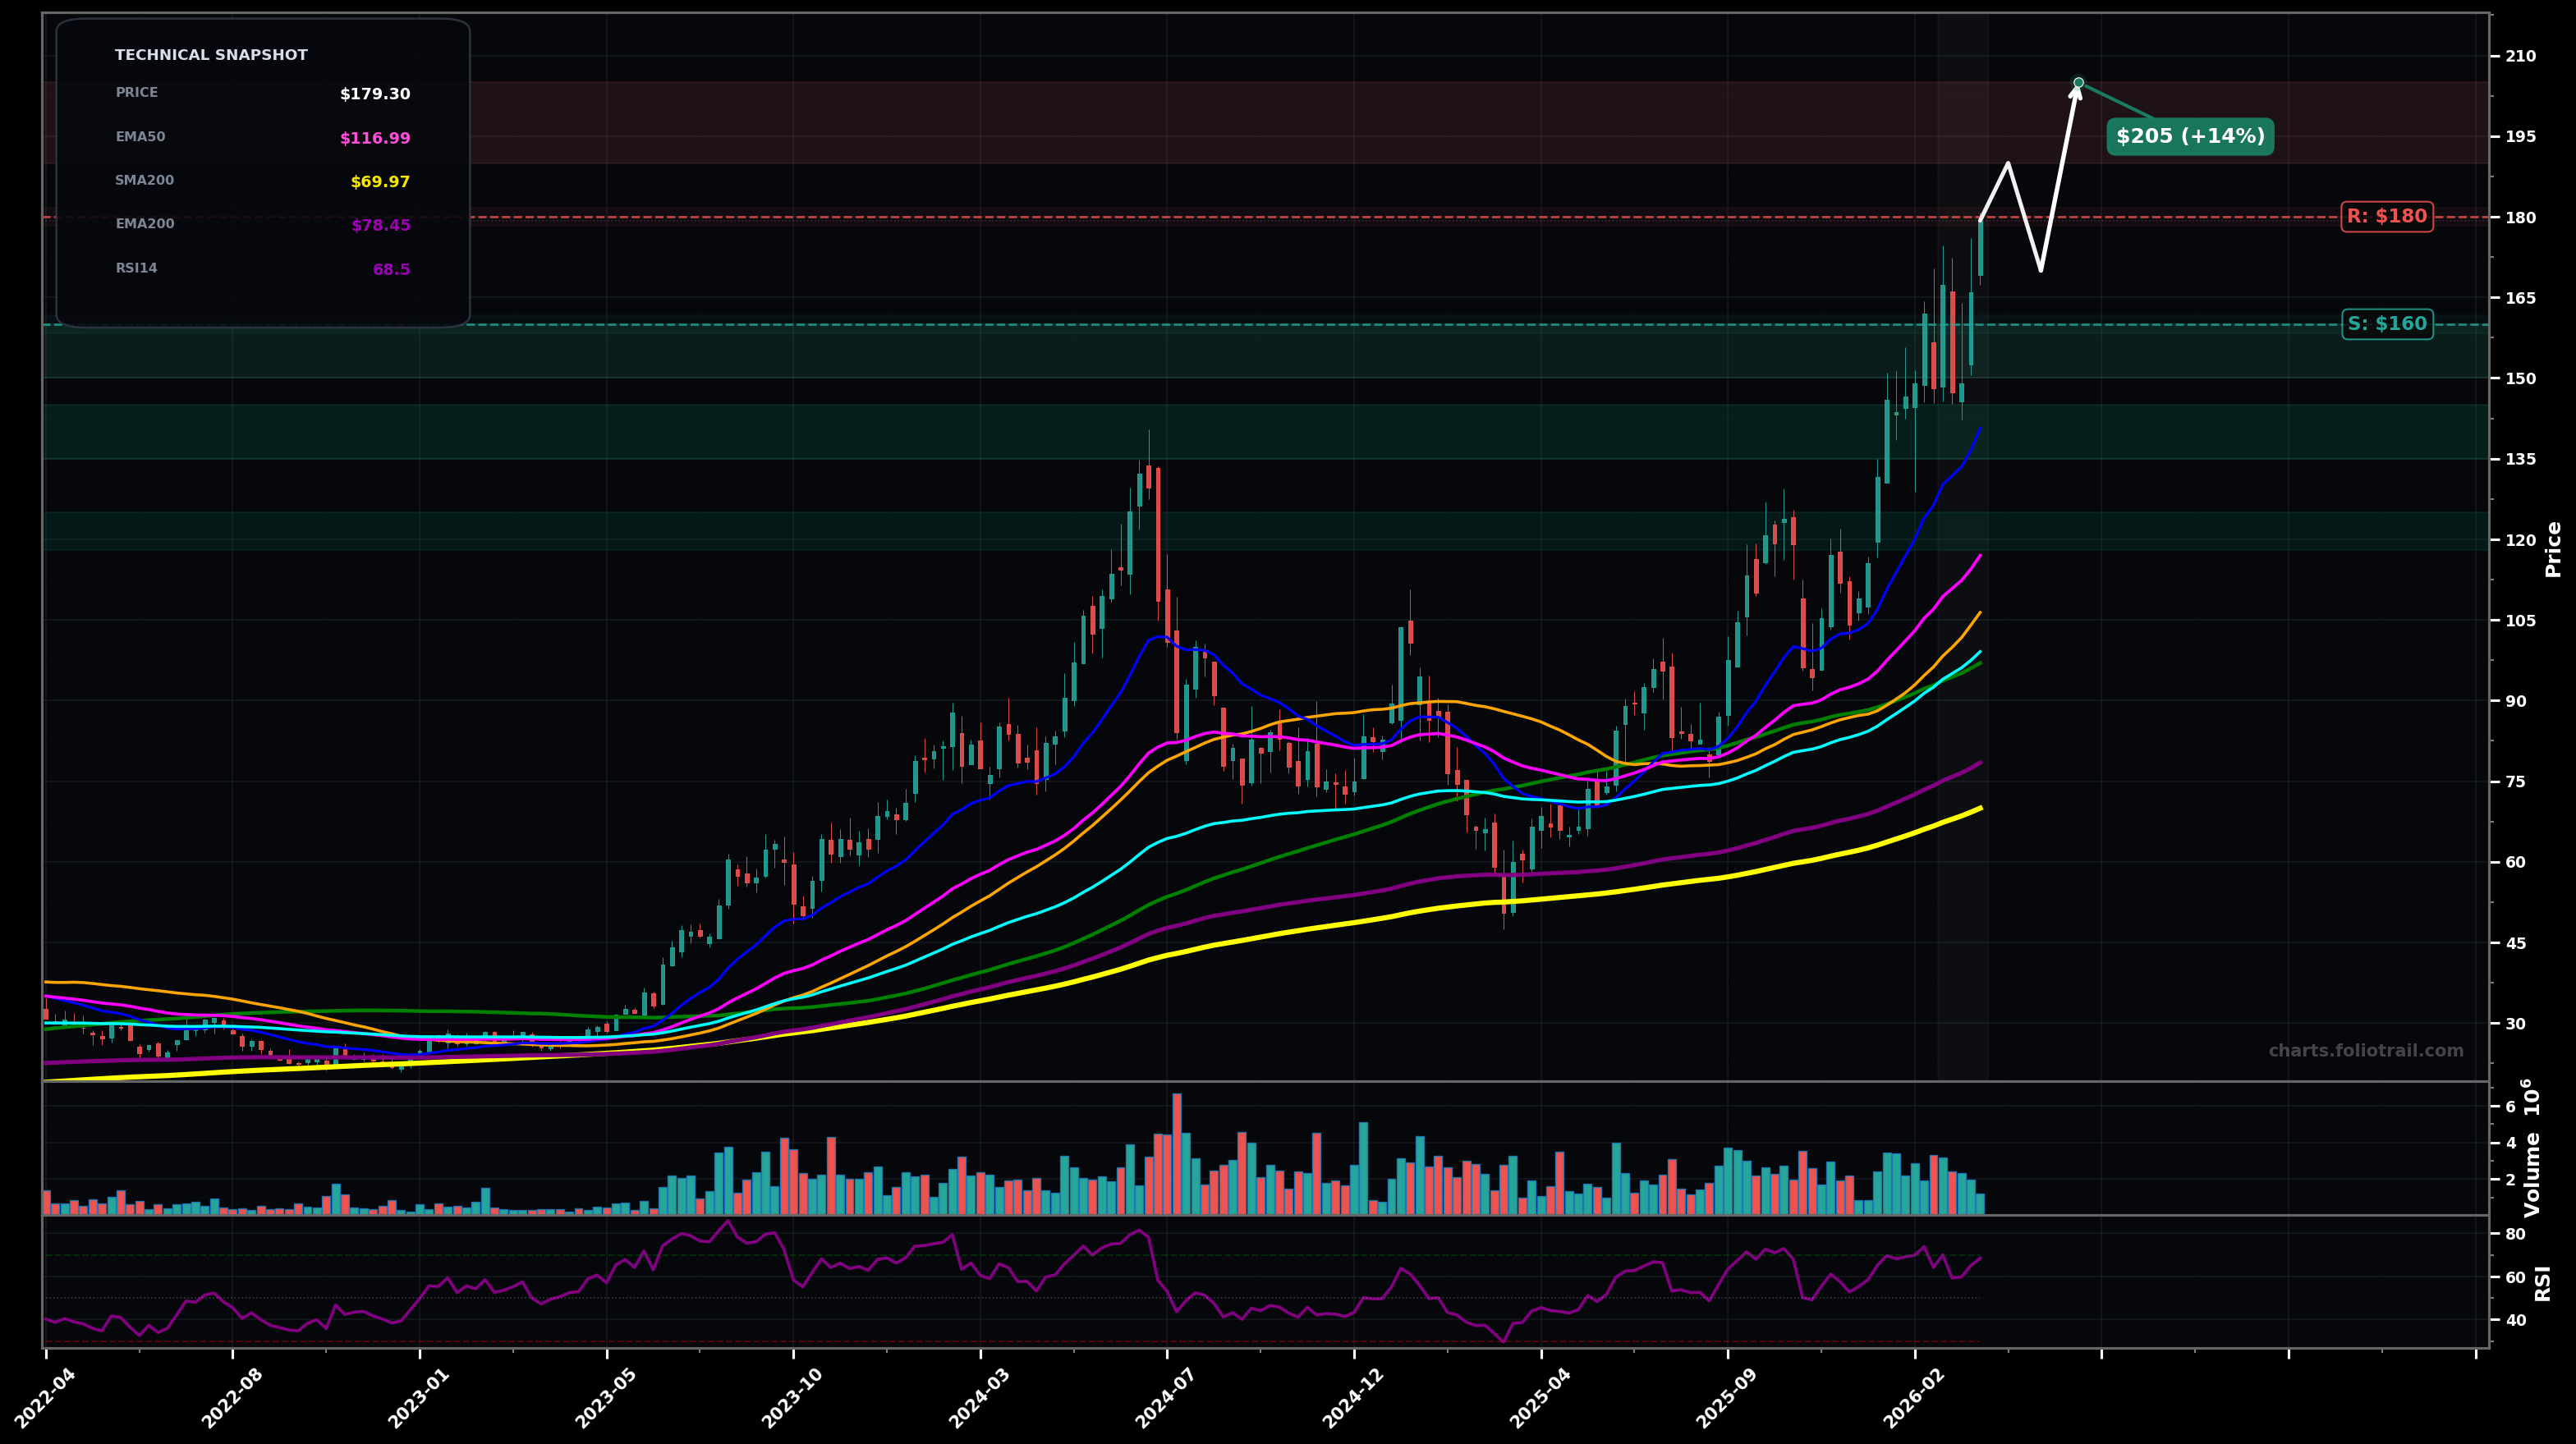
As of March 25, 2026, CAMT (Camtek Ltd.) is in a parabolic state on the weekly chart, with a confidence level of 72%. Key support is at $160 and key resistance at $180. Strong HH/HL advance into new highs with price stretched well above rising EMA50/EMA100; RSI elevated (~68).
Continuation breakout: price grinds higher after brief pause/consolidation, then extends the impulse leg (Elliott: late wave 3 or wave 5 extension).
Parabolic mean-reversion: a sharp pullback/ABC correction to reset momentum, likely retracing toward the prior breakout zone/fast MAs before attempting another push.
Weekly close above $180.00 with follow-through (another close holding >$180.00).
Weekly close below $160.00 (momentum break and first meaningful loss of recent swing support).
Buy-the-dip framework: $150-$160 aligns with prior swing structure; $135-$145 is a deeper Fibonacci-style pullback zone; $118-$125 is near the rising EMA50 area for higher R:R if mean reversion occurs.
In a parabolic state, trimming into extensions is favored: $190-$205 is a logical first extension; above $205 risk of larger ABC grows; $230+ implies multi-year stretch relative to long MAs (EMA200/SMA200) and increases drawdown risk.
As of March 25, 2026, CAMT (Camtek Ltd.) is in a parabolic state on the weekly chart with 72% confidence. Strong HH/HL advance into new highs with price stretched well above rising EMA50/EMA100; RSI elevated (~68).
On the weekly timeframe, CAMT has key support at $160 and key resistance at $180. The most likely scenario (bullish) targets $190 and $205, with a revert level at $170.
CAMT (Camtek Ltd.) is currently classified as parabolic on the weekly chart, with 72% confidence. Confirmation requires: Weekly close above $180.00 with follow-through (another close holding >$180.00). This would be invalidated by: Weekly close below $160.00 (momentum break and first meaningful loss of recent swing support).
The most likely scenario (bullish) targets $190 and $205, with a revert level at $170. The alternative scenario (bearish) targets $150 and $135.
Multi-layer AI agents analyse 200+ stocks across daily, weekly, and monthly timeframes — producing market state classifications, price scenarios with targets, and position entry/exit levels. Updated every trading day after market close. No paywall. No sign-up required.
Built by Foliotrail.
All content on this website — including charts, analysis, price targets, support/resistance levels, and position zones — is generated entirely by AI and provided for educational and informational purposes only.
This is not financial advice. NEXUSNOIR VENTURES SL (the operator of this website) is not a registered investment adviser or broker-dealer. You should not make investment decisions based solely on this information. Always do your own research and consult a qualified financial advisor.
By continuing, you acknowledge that you have read and agree to our full disclaimer & terms of use and privacy policy.