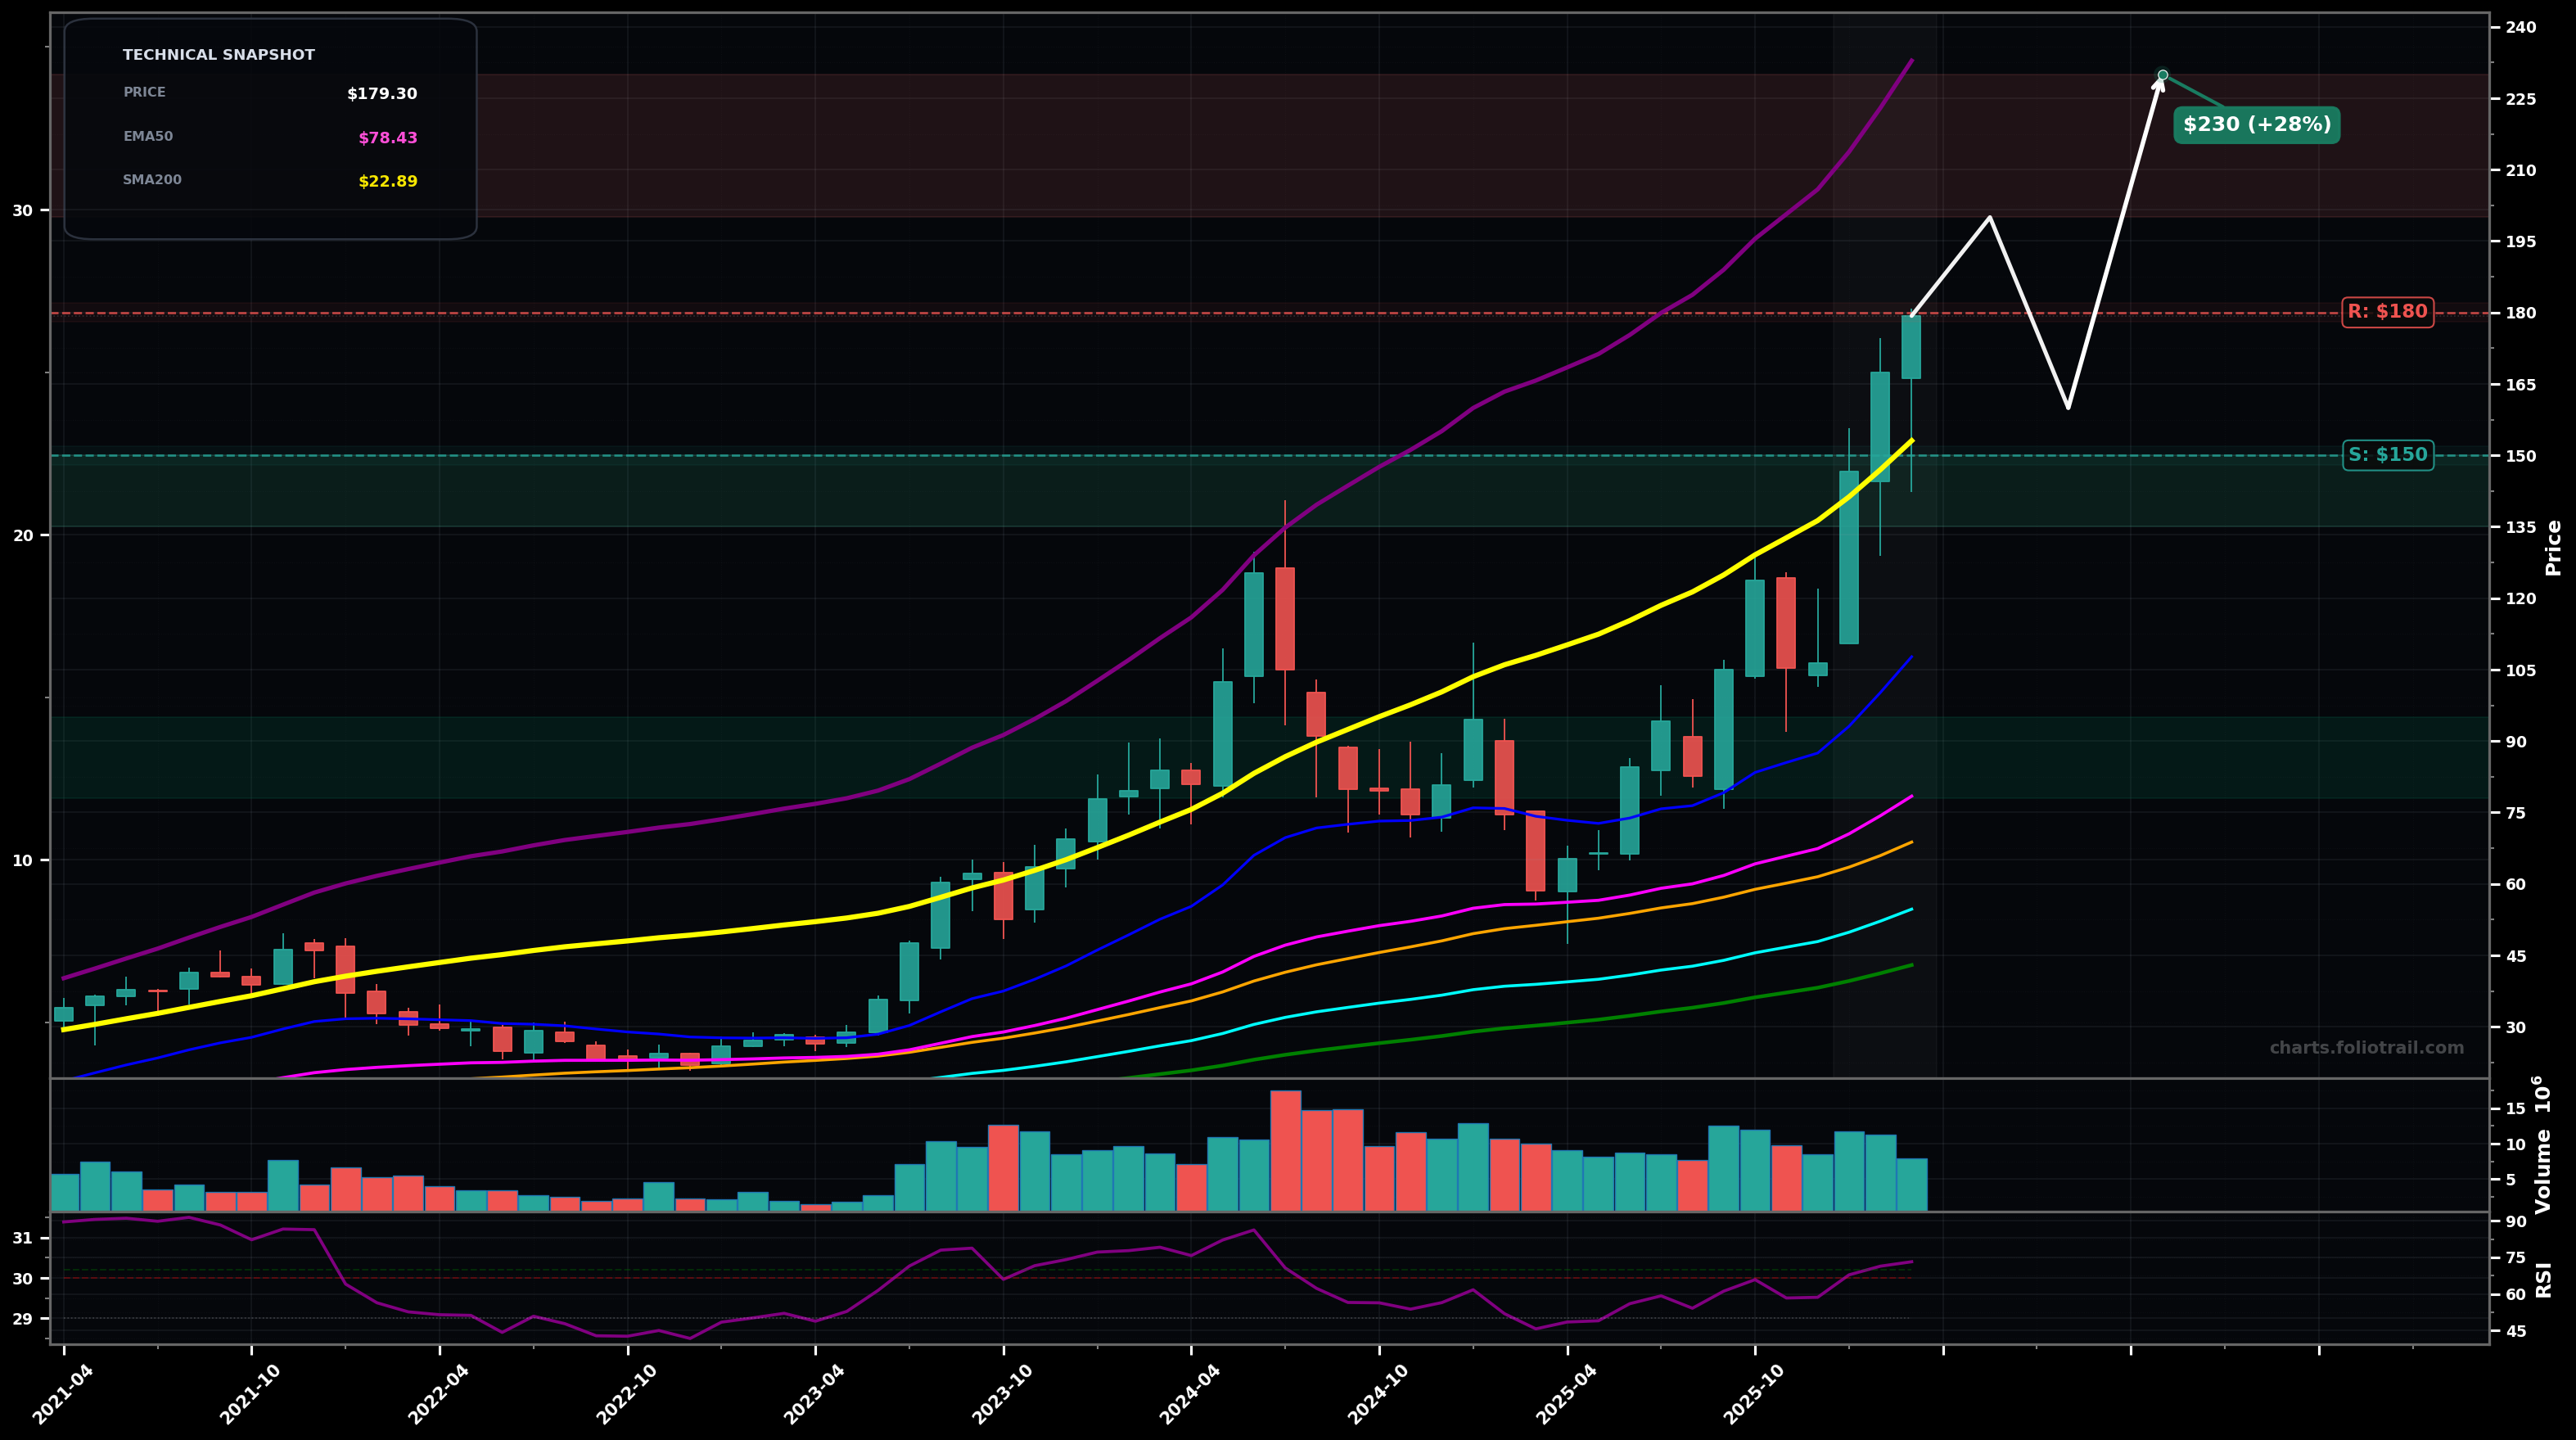
As of March 25, 2026, CAMT (Camtek Ltd.) is in a parabolic state on the monthly chart, with a confidence level of 74%. Key support is at $150 and key resistance at $180. Strong monthly continuation to fresh highs; price is far above all listed EMAs/SMAs with RSI(14) ~73 (overbought/extended).
Continuation push (likely Wave 5 extension) into new highs, then a sharp but controlled pullback to retest the breakout zone before attempting another leg up.
Parabolic blow-off fails: momentum cools and price mean-reverts toward the rising EMA20 area, forming a higher low or first meaningful LH/LL sequence on the way down.
Monthly close above $180 with a higher low holding above $150
Monthly close below $150 (break of last breakout zone; parabola likely ending)
Buy zones are mapped to likely Wave-4/Wave-A pullback areas and major prior breakout support ($135-$150), then deeper mean reversion toward the EMA20/SMA50 region (~$100-110), with capitulation value near EMA50 (~$78).
Trims scale into extension targets (round-number + fib extension behavior) where price is increasingly detached from EMA50/100; full exit reserved for extreme multi-year overextension/blow-off risk.
As of March 25, 2026, CAMT (Camtek Ltd.) is in a parabolic state on the monthly chart with 74% confidence. Strong monthly continuation to fresh highs; price is far above all listed EMAs/SMAs with RSI(14) ~73 (overbought/extended).
On the monthly timeframe, CAMT has key support at $150 and key resistance at $180. The most likely scenario (bullish) targets $200 and $230, with a revert level at $160.
CAMT (Camtek Ltd.) is currently classified as parabolic on the monthly chart, with 74% confidence. Confirmation requires: Monthly close above $180 with a higher low holding above $150 This would be invalidated by: Monthly close below $150 (break of last breakout zone; parabola likely ending)
The most likely scenario (bullish) targets $200 and $230, with a revert level at $160. The alternative scenario (bearish) targets $135 and $110.
Multi-layer AI agents analyse 200+ stocks across daily, weekly, and monthly timeframes — producing market state classifications, price scenarios with targets, and position entry/exit levels. Updated every trading day after market close. No paywall. No sign-up required.
Built by Foliotrail.
All content on this website — including charts, analysis, price targets, support/resistance levels, and position zones — is generated entirely by AI and provided for educational and informational purposes only.
This is not financial advice. NEXUSNOIR VENTURES SL (the operator of this website) is not a registered investment adviser or broker-dealer. You should not make investment decisions based solely on this information. Always do your own research and consult a qualified financial advisor.
By continuing, you acknowledge that you have read and agree to our full disclaimer & terms of use and privacy policy.