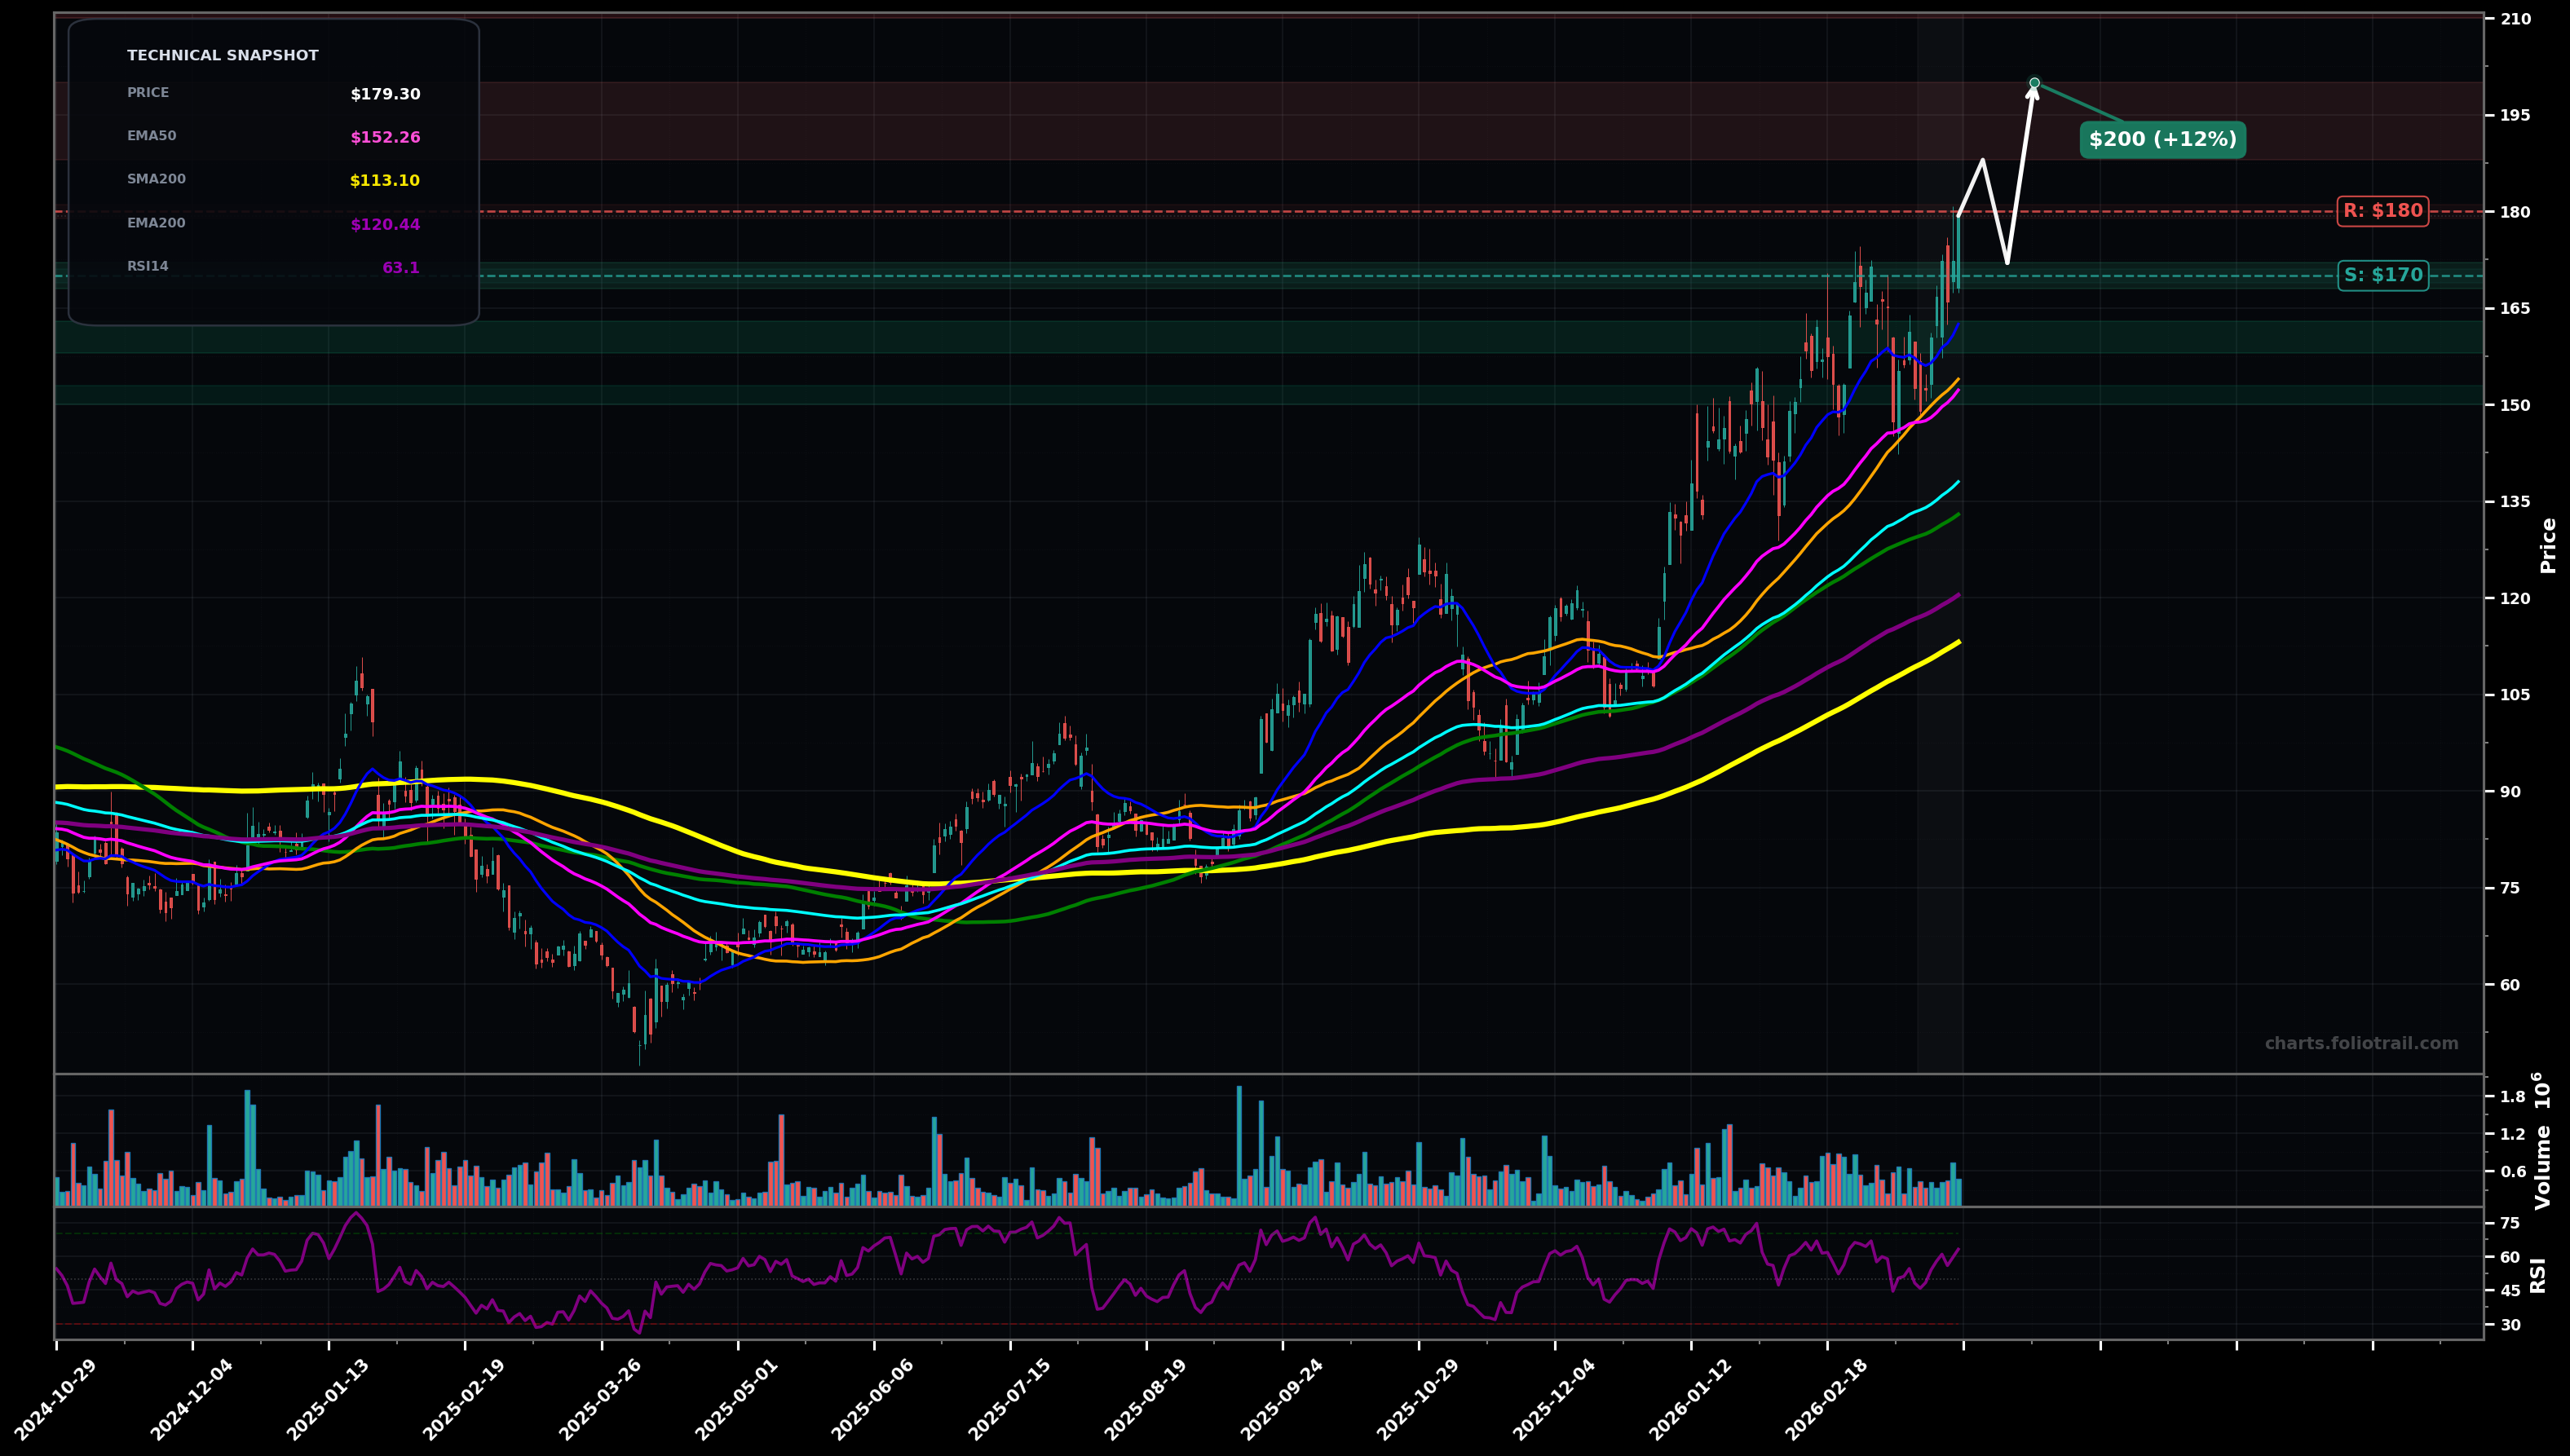
As of March 25, 2026, CAMT (Camtek Ltd.) is in a uptrend state on the daily chart, with a confidence level of 74%. Key support is at $170 and key resistance at $180. Price is making HH/HL and just pushed to fresh highs near $180 after a shallow pullback; all key MAs are stacked bullish with momentum (RSI14 ~63).
Bullish continuation: brief consolidation above $170 then breakout through $180, extending the impulse leg; Elliott view: late Wave 3 or Wave 5 extension with buyers defending EMA20/EMA50; Fib extension from the latest swing projects next supply near the low-$190s then ~$200.
Pullback/flag resolution lower: rejection near $180 leads to a deeper mean-reversion to EMA50/SMA50 zone; Elliott view: Wave 4-type correction (sideways-to-down) before another attempt higher; watch for a higher low vs the prior pivot to keep the trend intact.
Hold above $170 with 2+ daily closes (no breakdown back under EMA20/EMA50).
Daily close below $160 (loss of EMA20 and likely EMA50 reclaim failure).
Start near prior breakout/round-number support ($170); add into EMA50/SMA50 confluence (~$160); heavy add near EMA50 value area/SMA50 and prior base top (~$152) if a higher-low structure forms.
Trim into Fib extension/psychological levels ($190–$200 first), then larger trims if price becomes stretched above rising EMA50/100; full close only if multi-year extension blow-off develops well above $225 with momentum extremes.
As of March 25, 2026, CAMT (Camtek Ltd.) is in a uptrend state on the daily chart with 74% confidence. Price is making HH/HL and just pushed to fresh highs near $180 after a shallow pullback; all key MAs are stacked bullish with momentum (RSI14 ~63).
On the daily timeframe, CAMT has key support at $170 and key resistance at $180. The most likely scenario (bullish) targets $188 and $200, with a revert level at $172.
CAMT (Camtek Ltd.) is currently classified as uptrend on the daily chart, with 74% confidence. Confirmation requires: Hold above $170 with 2+ daily closes (no breakdown back under EMA20/EMA50). This would be invalidated by: Daily close below $160 (loss of EMA20 and likely EMA50 reclaim failure).
The most likely scenario (bullish) targets $188 and $200, with a revert level at $172. The alternative scenario (bearish) targets $162 and $152.
Multi-layer AI agents analyse 200+ stocks across daily, weekly, and monthly timeframes — producing market state classifications, price scenarios with targets, and position entry/exit levels. Updated every trading day after market close. No paywall. No sign-up required.
Built by Foliotrail.
All content on this website — including charts, analysis, price targets, support/resistance levels, and position zones — is generated entirely by AI and provided for educational and informational purposes only.
This is not financial advice. NEXUSNOIR VENTURES SL (the operator of this website) is not a registered investment adviser or broker-dealer. You should not make investment decisions based solely on this information. Always do your own research and consult a qualified financial advisor.
By continuing, you acknowledge that you have read and agree to our full disclaimer & terms of use and privacy policy.