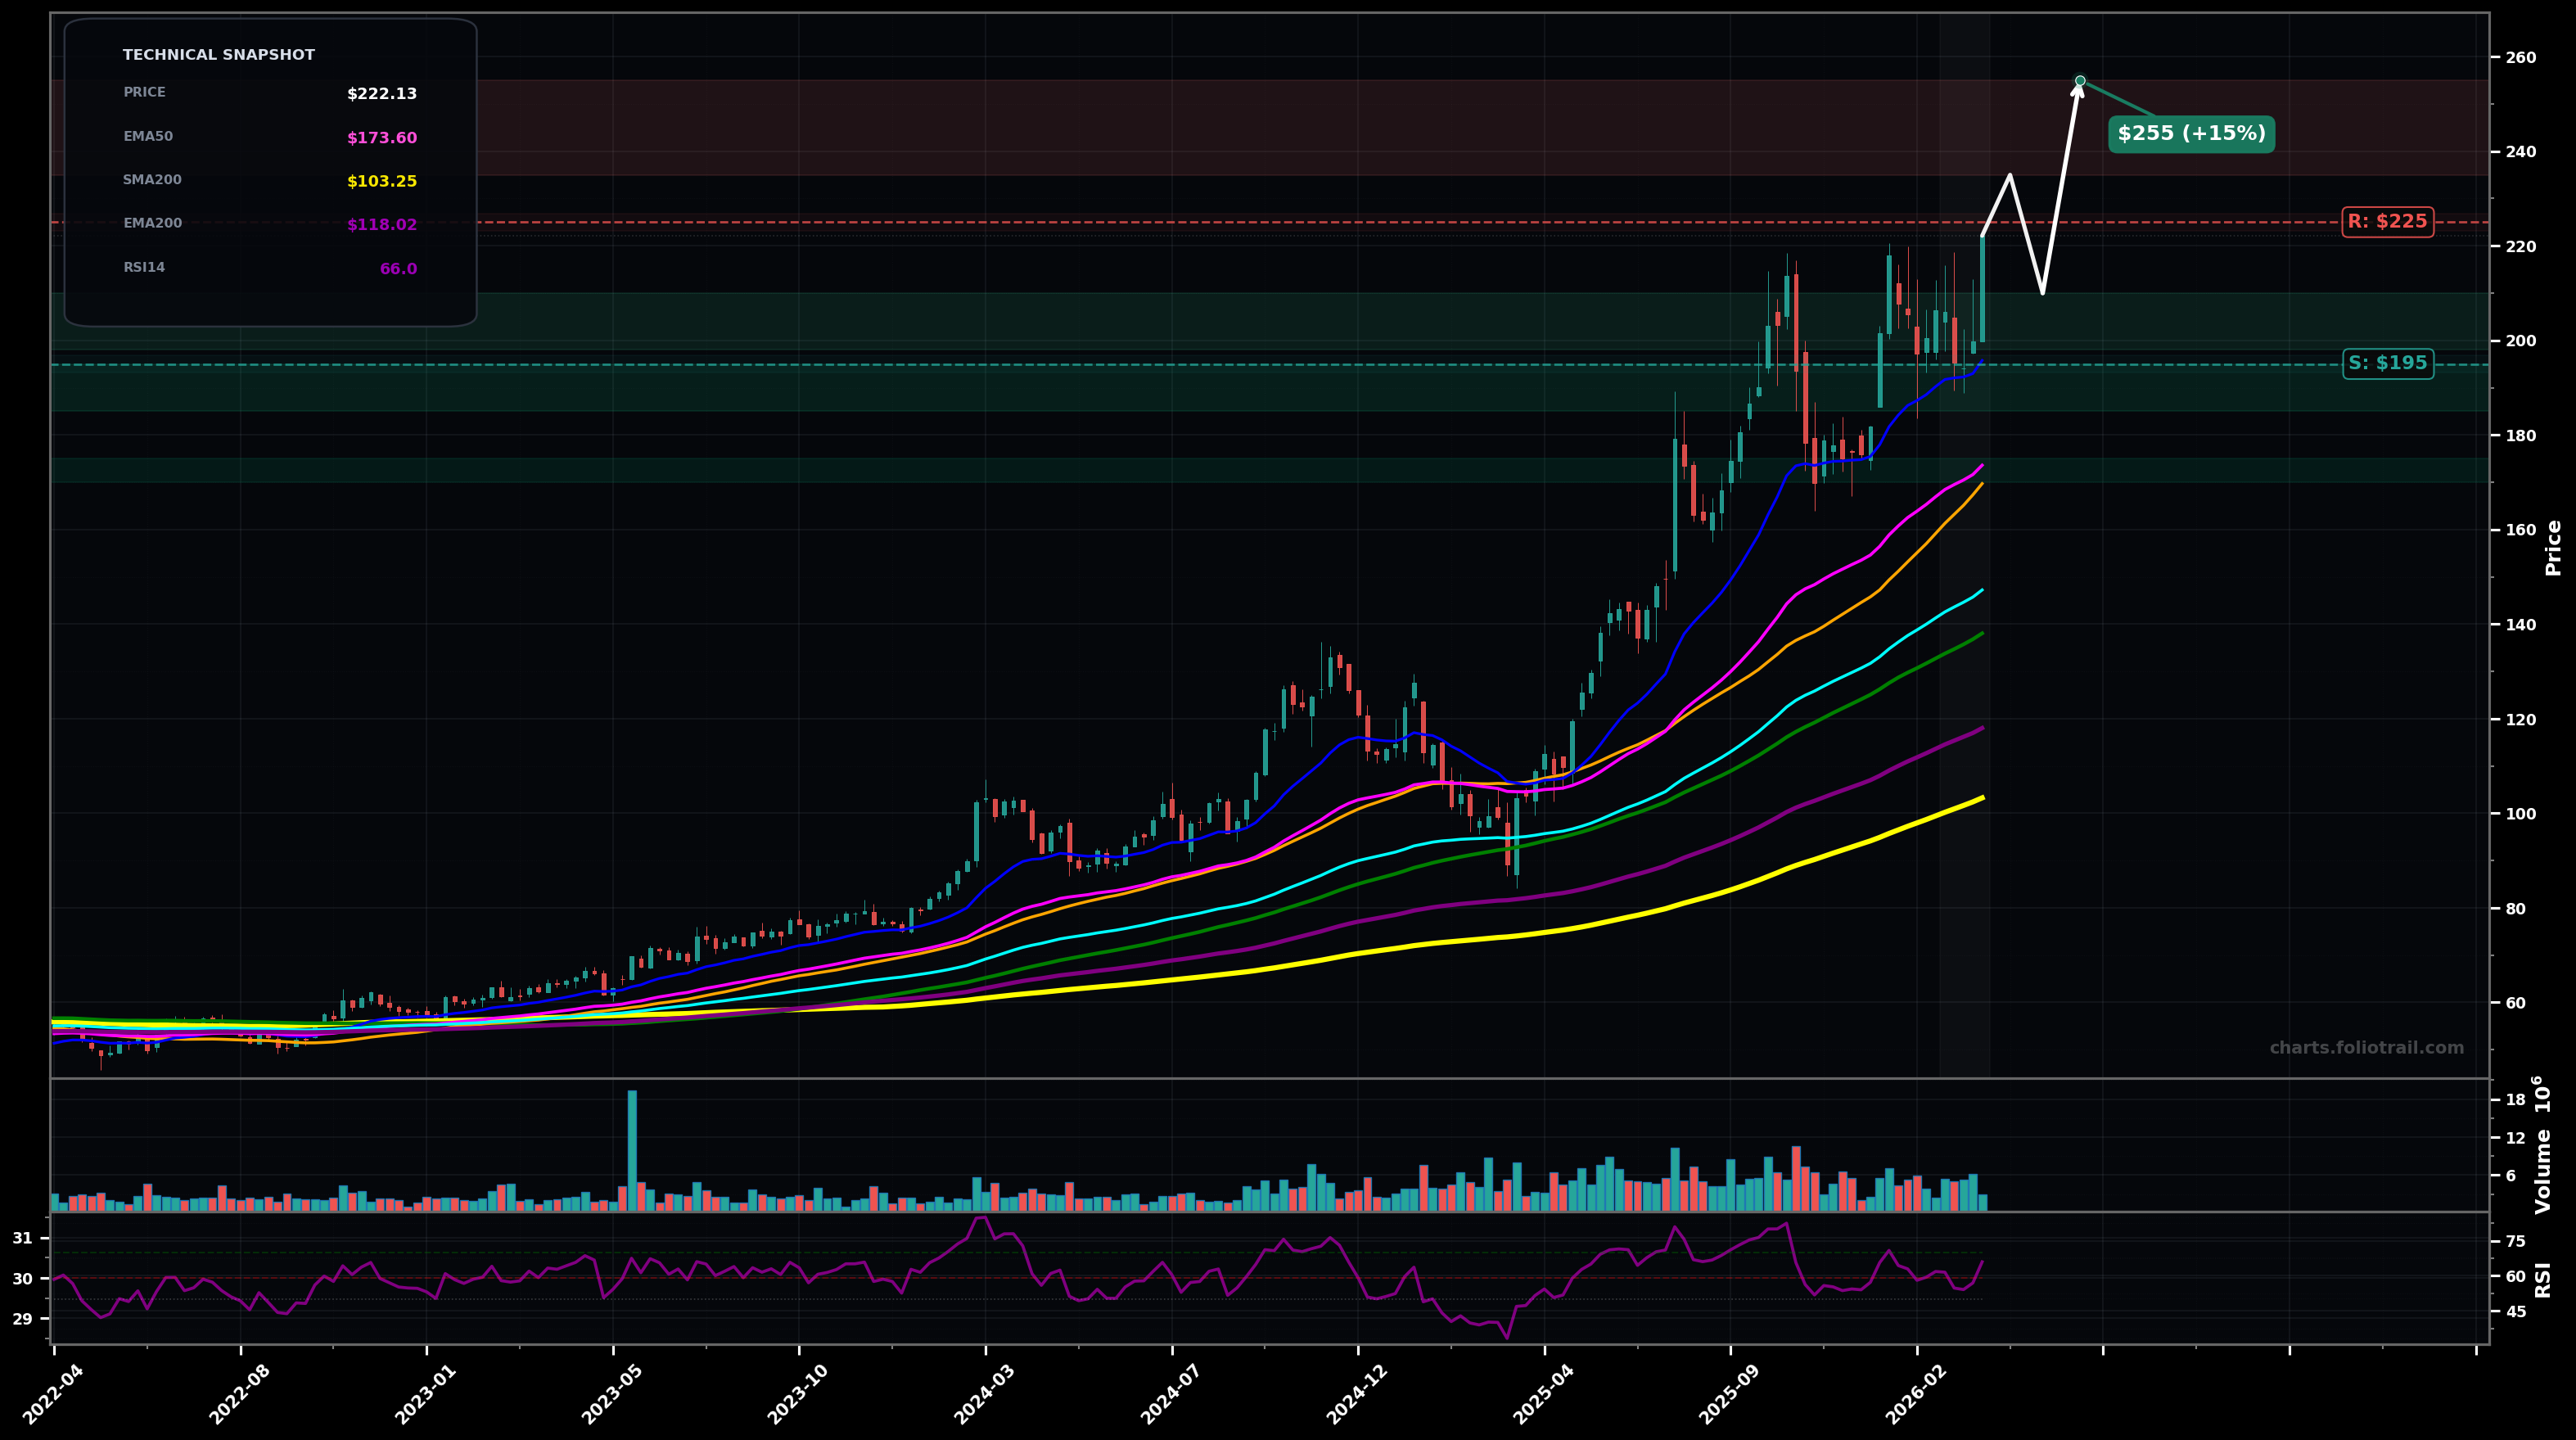
As of March 26, 2026, BWXT (Bwx Technologies Inc.) is in a uptrend state on the weekly chart, with a confidence level of 78%. Key support is at $195 and key resistance at $225. Weekly price is pressing to fresh highs around $222 after a multi-week consolidation above the fast MAs; momentum firm (RSI~66).
Bullish continuation: breakout from the recent range into a Wave-5 style advance; initial expansion targets come from prior range height and Fib extensions of the last pullback.
Bearish alternate: failed breakout / bull trap; price pulls back to test the breakout base and the rising EMA50 area (typical Wave-4 style retrace) before deciding trend continuation vs deeper correction.
Weekly close above $225 holding for 2+ weeks
Weekly close below $195 (loss of the recent pivot/fast MA zone)
Buy-the-dip bias while above the breakout base (~$195-$210); add into support tests; heavy add aligns with EMA50/SMA50 confluence (~$170s) if a deeper Wave-4 unfolds.
Trim into upside extensions as price stretches far above EMA50/EMA100; larger derisk/exit zones align with probable Fib extension bands and sentiment/RSI heat typical near late-wave peaks.
As of March 26, 2026, BWXT (Bwx Technologies Inc.) is in a uptrend state on the weekly chart with 78% confidence. Weekly price is pressing to fresh highs around $222 after a multi-week consolidation above the fast MAs; momentum firm (RSI~66).
On the weekly timeframe, BWXT has key support at $195 and key resistance at $225. The most likely scenario (bullish) targets $235 and $255, with a revert level at $210.
BWXT (Bwx Technologies Inc.) is currently classified as uptrend on the weekly chart, with 78% confidence. Confirmation requires: Weekly close above $225 holding for 2+ weeks This would be invalidated by: Weekly close below $195 (loss of the recent pivot/fast MA zone)
The most likely scenario (bullish) targets $235 and $255, with a revert level at $210. The alternative scenario (bearish) targets $195 and $174.
Multi-layer AI agents analyse 200+ stocks across daily, weekly, and monthly timeframes — producing market state classifications, price scenarios with targets, and position entry/exit levels. Updated every trading day after market close. No paywall. No sign-up required.
Built by Foliotrail.
All content on this website — including charts, analysis, price targets, support/resistance levels, and position zones — is generated entirely by AI and provided for educational and informational purposes only.
This is not financial advice. NEXUSNOIR VENTURES SL (the operator of this website) is not a registered investment adviser or broker-dealer. You should not make investment decisions based solely on this information. Always do your own research and consult a qualified financial advisor.
By continuing, you acknowledge that you have read and agree to our full disclaimer & terms of use and privacy policy.