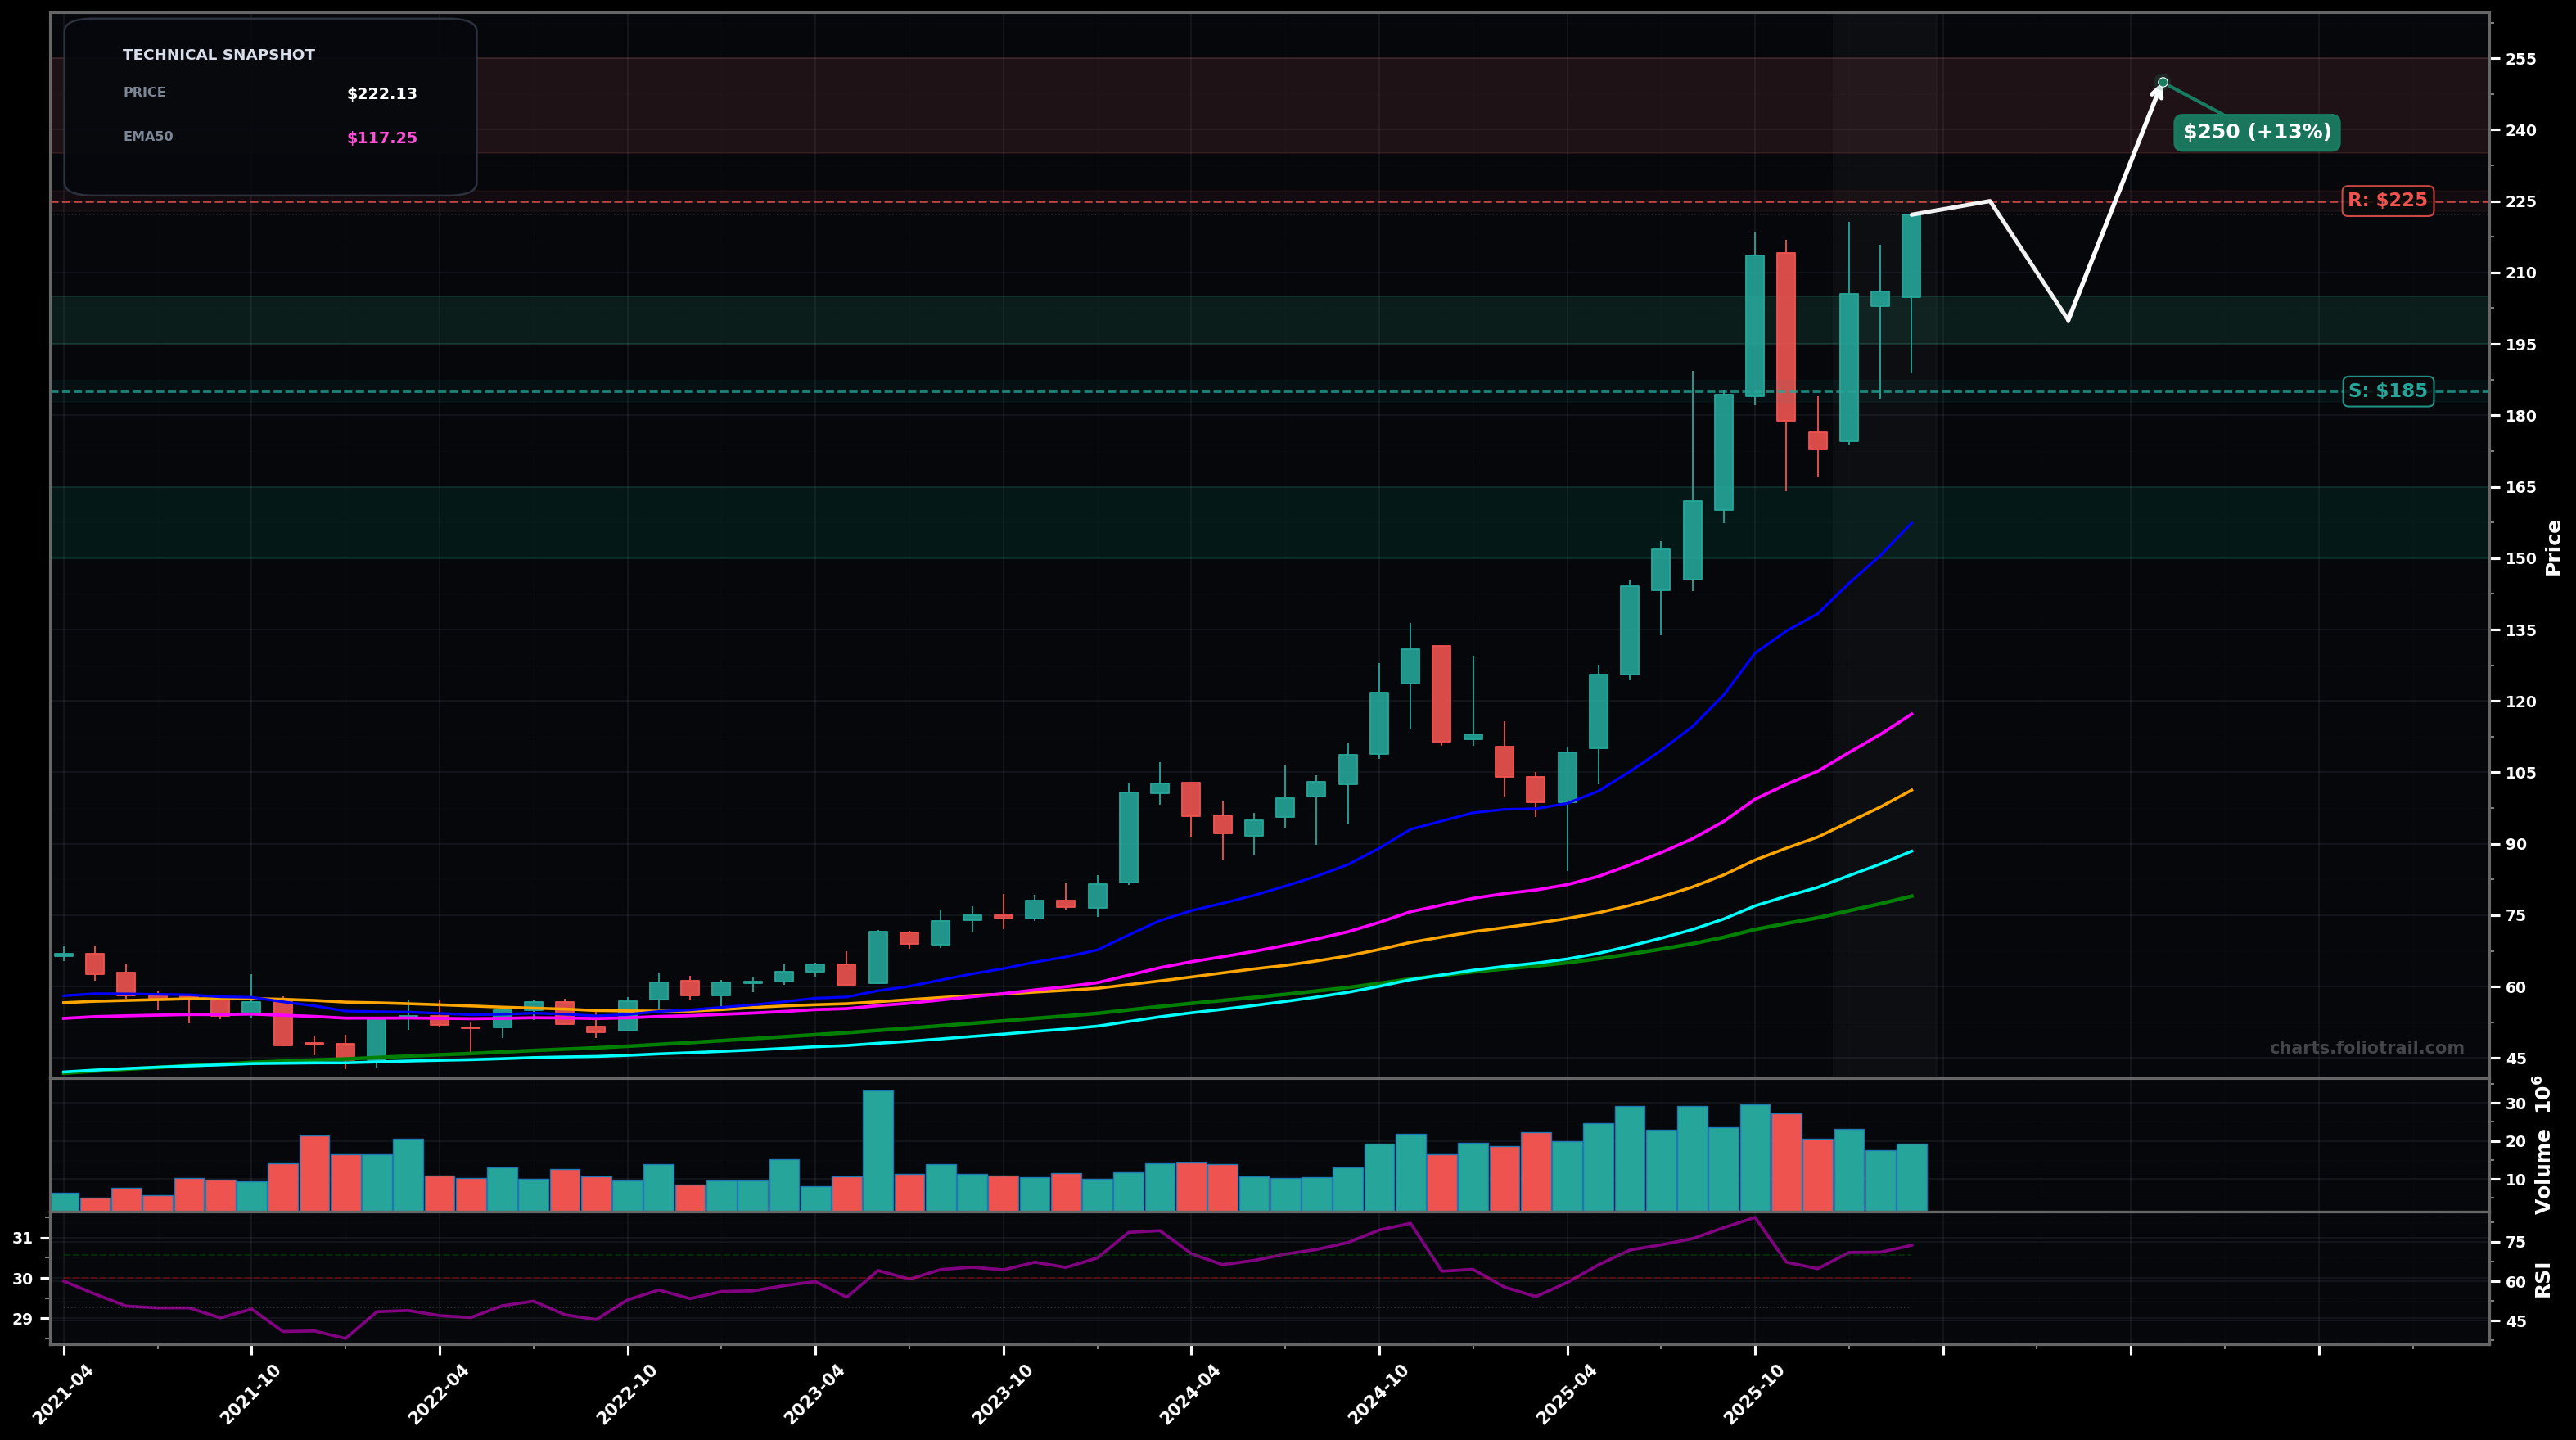
As of March 26, 2026, BWXT (Bwx Technologies Inc.) is in a parabolic state on the monthly chart, with a confidence level of 67%. Key support is at $185 and key resistance at $225. Monthly uptrend resumed with a push to new highs around $220 after a sharp pullback from the prior peak; momentum remains strong (RSI ~73).
Bullish continuation but with a likely pause: price consolidates above $200, then attempts a breakout through ~$225; Elliott-wave view: late Wave 5 extension or Wave 3 of a larger degree with shallow Wave 4-type pullbacks; Fibonacci: expect frequent 0.236–0.382 pullbacks of the last impulse before continuation.
Mean-reversion / deeper Wave 4-style correction: rejection near ~$225 leads to a pullback into the prior breakout shelf and moving-average magnet zone; Fibonacci: 0.382–0.50 retrace of the most recent $175→$220 leg points to the high-$190s/low-$200s first, then potentially the ~$170s if risk-off broadens.
Monthly close above $225 with follow-through (another close holding above $225).
Monthly close below $185 (breaks the most recent higher-low zone and signals a deeper mean-reversion).
Start near the prior breakout/round-number support (~$200); add on a deeper pullback into the last swing-low zone (~$170–$185); heavy-add only if a larger 0.5–0.618 retrace/EMA50 (pink) catch-up occurs (~$150–$165).
In a parabolic state, trims are defined by extension above the recent highs and likely Fibonacci extensions (1.272–1.618) where upside becomes increasingly asymmetric to the downside; scale out more aggressively as price pushes further away from EMA50/EMA100.
As of March 26, 2026, BWXT (Bwx Technologies Inc.) is in a parabolic state on the monthly chart with 67% confidence. Monthly uptrend resumed with a push to new highs around $220 after a sharp pullback from the prior peak; momentum remains strong (RSI ~73).
On the monthly timeframe, BWXT has key support at $185 and key resistance at $225. The most likely scenario (bullish) targets $225 and $250, with a revert level at $200.
BWXT (Bwx Technologies Inc.) is currently classified as parabolic on the monthly chart, with 67% confidence. Confirmation requires: Monthly close above $225 with follow-through (another close holding above $225). This would be invalidated by: Monthly close below $185 (breaks the most recent higher-low zone and signals a deeper mean-reversion).
The most likely scenario (bullish) targets $225 and $250, with a revert level at $200. The alternative scenario (bearish) targets $200 and $170.
Multi-layer AI agents analyse 200+ stocks across daily, weekly, and monthly timeframes — producing market state classifications, price scenarios with targets, and position entry/exit levels. Updated every trading day after market close. No paywall. No sign-up required.
Built by Foliotrail.
All content on this website — including charts, analysis, price targets, support/resistance levels, and position zones — is generated entirely by AI and provided for educational and informational purposes only.
This is not financial advice. NEXUSNOIR VENTURES SL (the operator of this website) is not a registered investment adviser or broker-dealer. You should not make investment decisions based solely on this information. Always do your own research and consult a qualified financial advisor.
By continuing, you acknowledge that you have read and agree to our full disclaimer & terms of use and privacy policy.