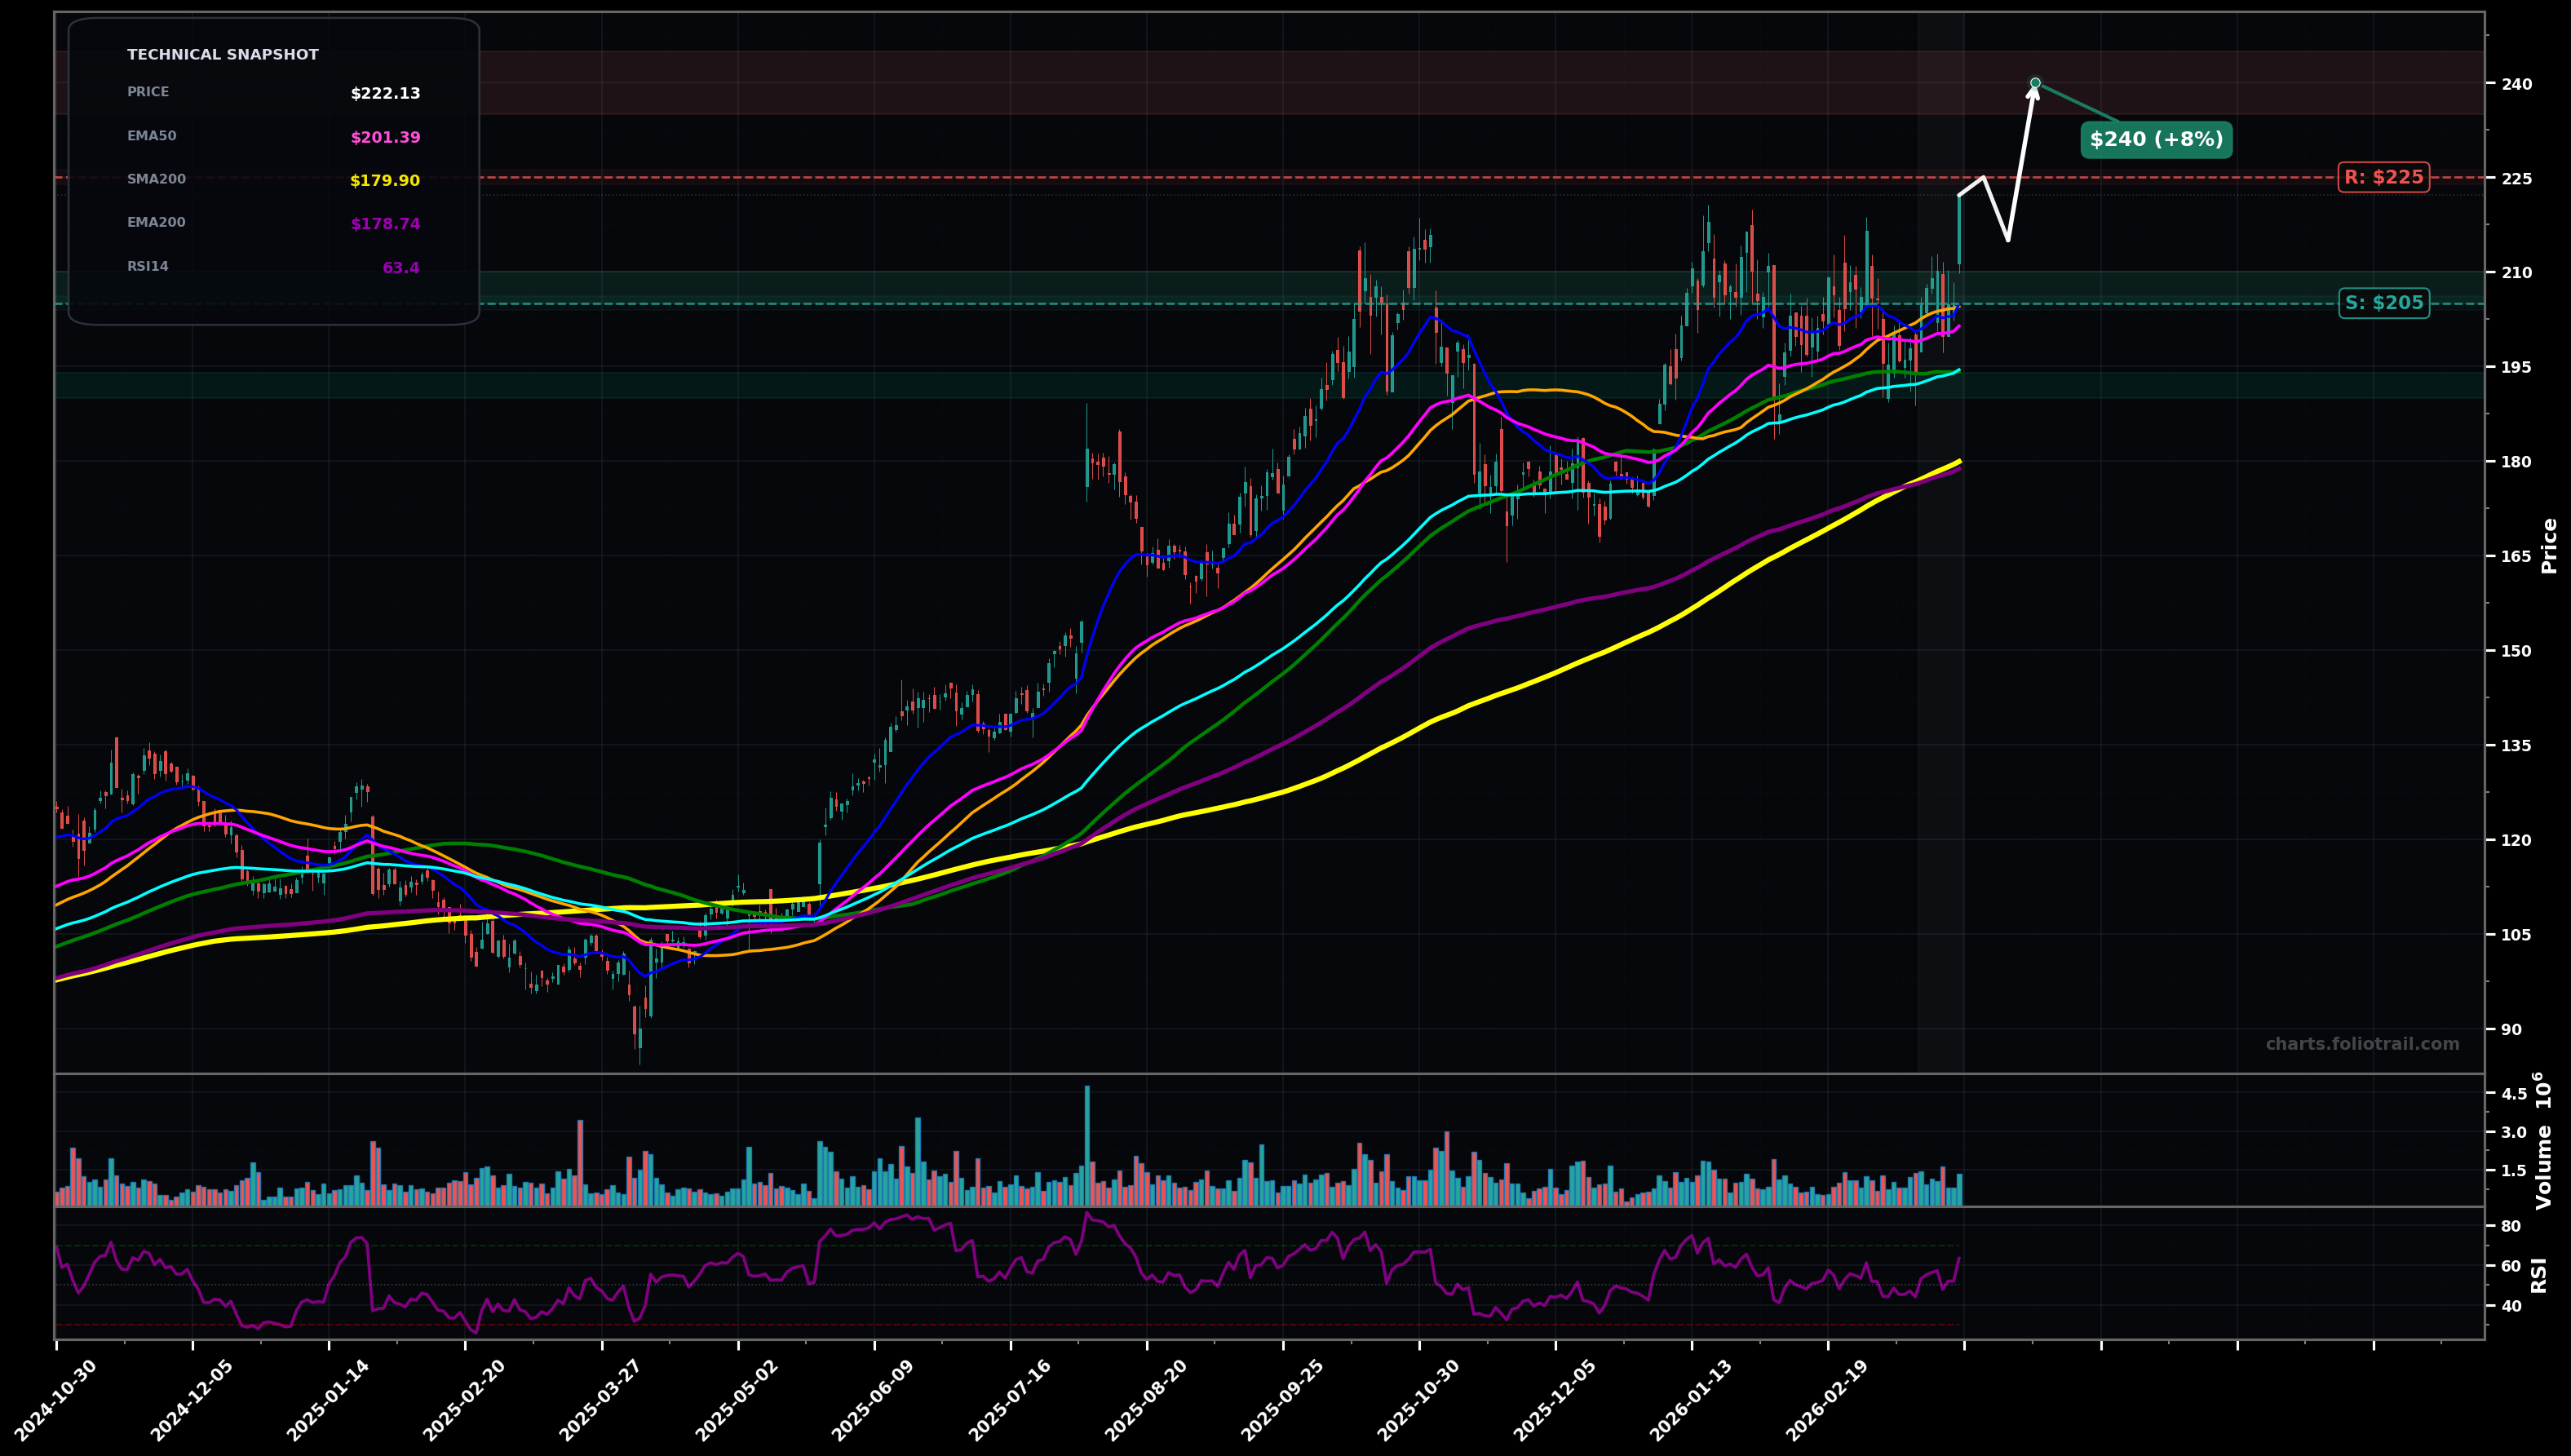
As of March 26, 2026, BWXT (Bwx Technologies Inc.) is in a uptrend state on the daily chart, with a confidence level of 74%. Key support is at $205 and key resistance at $225. Price at $222.13 pushed to fresh highs, holding above all key MAs; momentum positive (RSI ~$63) with trend MAs rising.
Bullish continuation: shallow pullback into the ~$210-$205 area (prior breakout + rising EMA/SMA cluster) then a push to new highs; Elliott view: likely in a Wave 5 extension or late Wave 3 of a smaller degree after a sideways Wave 4, with measured continuation if $215 holds.
Bearish digestion: rejection near ~$225 followed by a deeper mean-reversion toward the rising EMA100/SMA100 zone; Elliott view: potential larger-degree Wave 4 pullback if momentum fails, with Fib-style retrace risk toward the $198-$190 region before trend resumes.
Daily close holding above $215
Daily close below $201
Buy-the-dip plan around prior breakout support ($210-$205) then EMA100/SMA100 confluence ($198-$194); heavy add only on deeper Wave-4-type retrace toward ~$190-$194 while keeping long-term uptrend intact.
Trim into upside extension levels above current range (likely Wave-5/extension territory) as distance from EMA50/100 grows; heavier trimming/close if price becomes multi-year stretched vs the MA stack and prior breakout base.
As of March 26, 2026, BWXT (Bwx Technologies Inc.) is in a uptrend state on the daily chart with 74% confidence. Price at $222.13 pushed to fresh highs, holding above all key MAs; momentum positive (RSI ~$63) with trend MAs rising.
On the daily timeframe, BWXT has key support at $205 and key resistance at $225. The most likely scenario (bullish) targets $225 and $240, with a revert level at $215.
BWXT (Bwx Technologies Inc.) is currently classified as uptrend on the daily chart, with 74% confidence. Confirmation requires: Daily close holding above $215 This would be invalidated by: Daily close below $201
The most likely scenario (bullish) targets $225 and $240, with a revert level at $215. The alternative scenario (bearish) targets $200 and $194.
Multi-layer AI agents analyse 200+ stocks across daily, weekly, and monthly timeframes — producing market state classifications, price scenarios with targets, and position entry/exit levels. Updated every trading day after market close. No paywall. No sign-up required.
Built by Foliotrail.
All content on this website — including charts, analysis, price targets, support/resistance levels, and position zones — is generated entirely by AI and provided for educational and informational purposes only.
This is not financial advice. NEXUSNOIR VENTURES SL (the operator of this website) is not a registered investment adviser or broker-dealer. You should not make investment decisions based solely on this information. Always do your own research and consult a qualified financial advisor.
By continuing, you acknowledge that you have read and agree to our full disclaimer & terms of use and privacy policy.