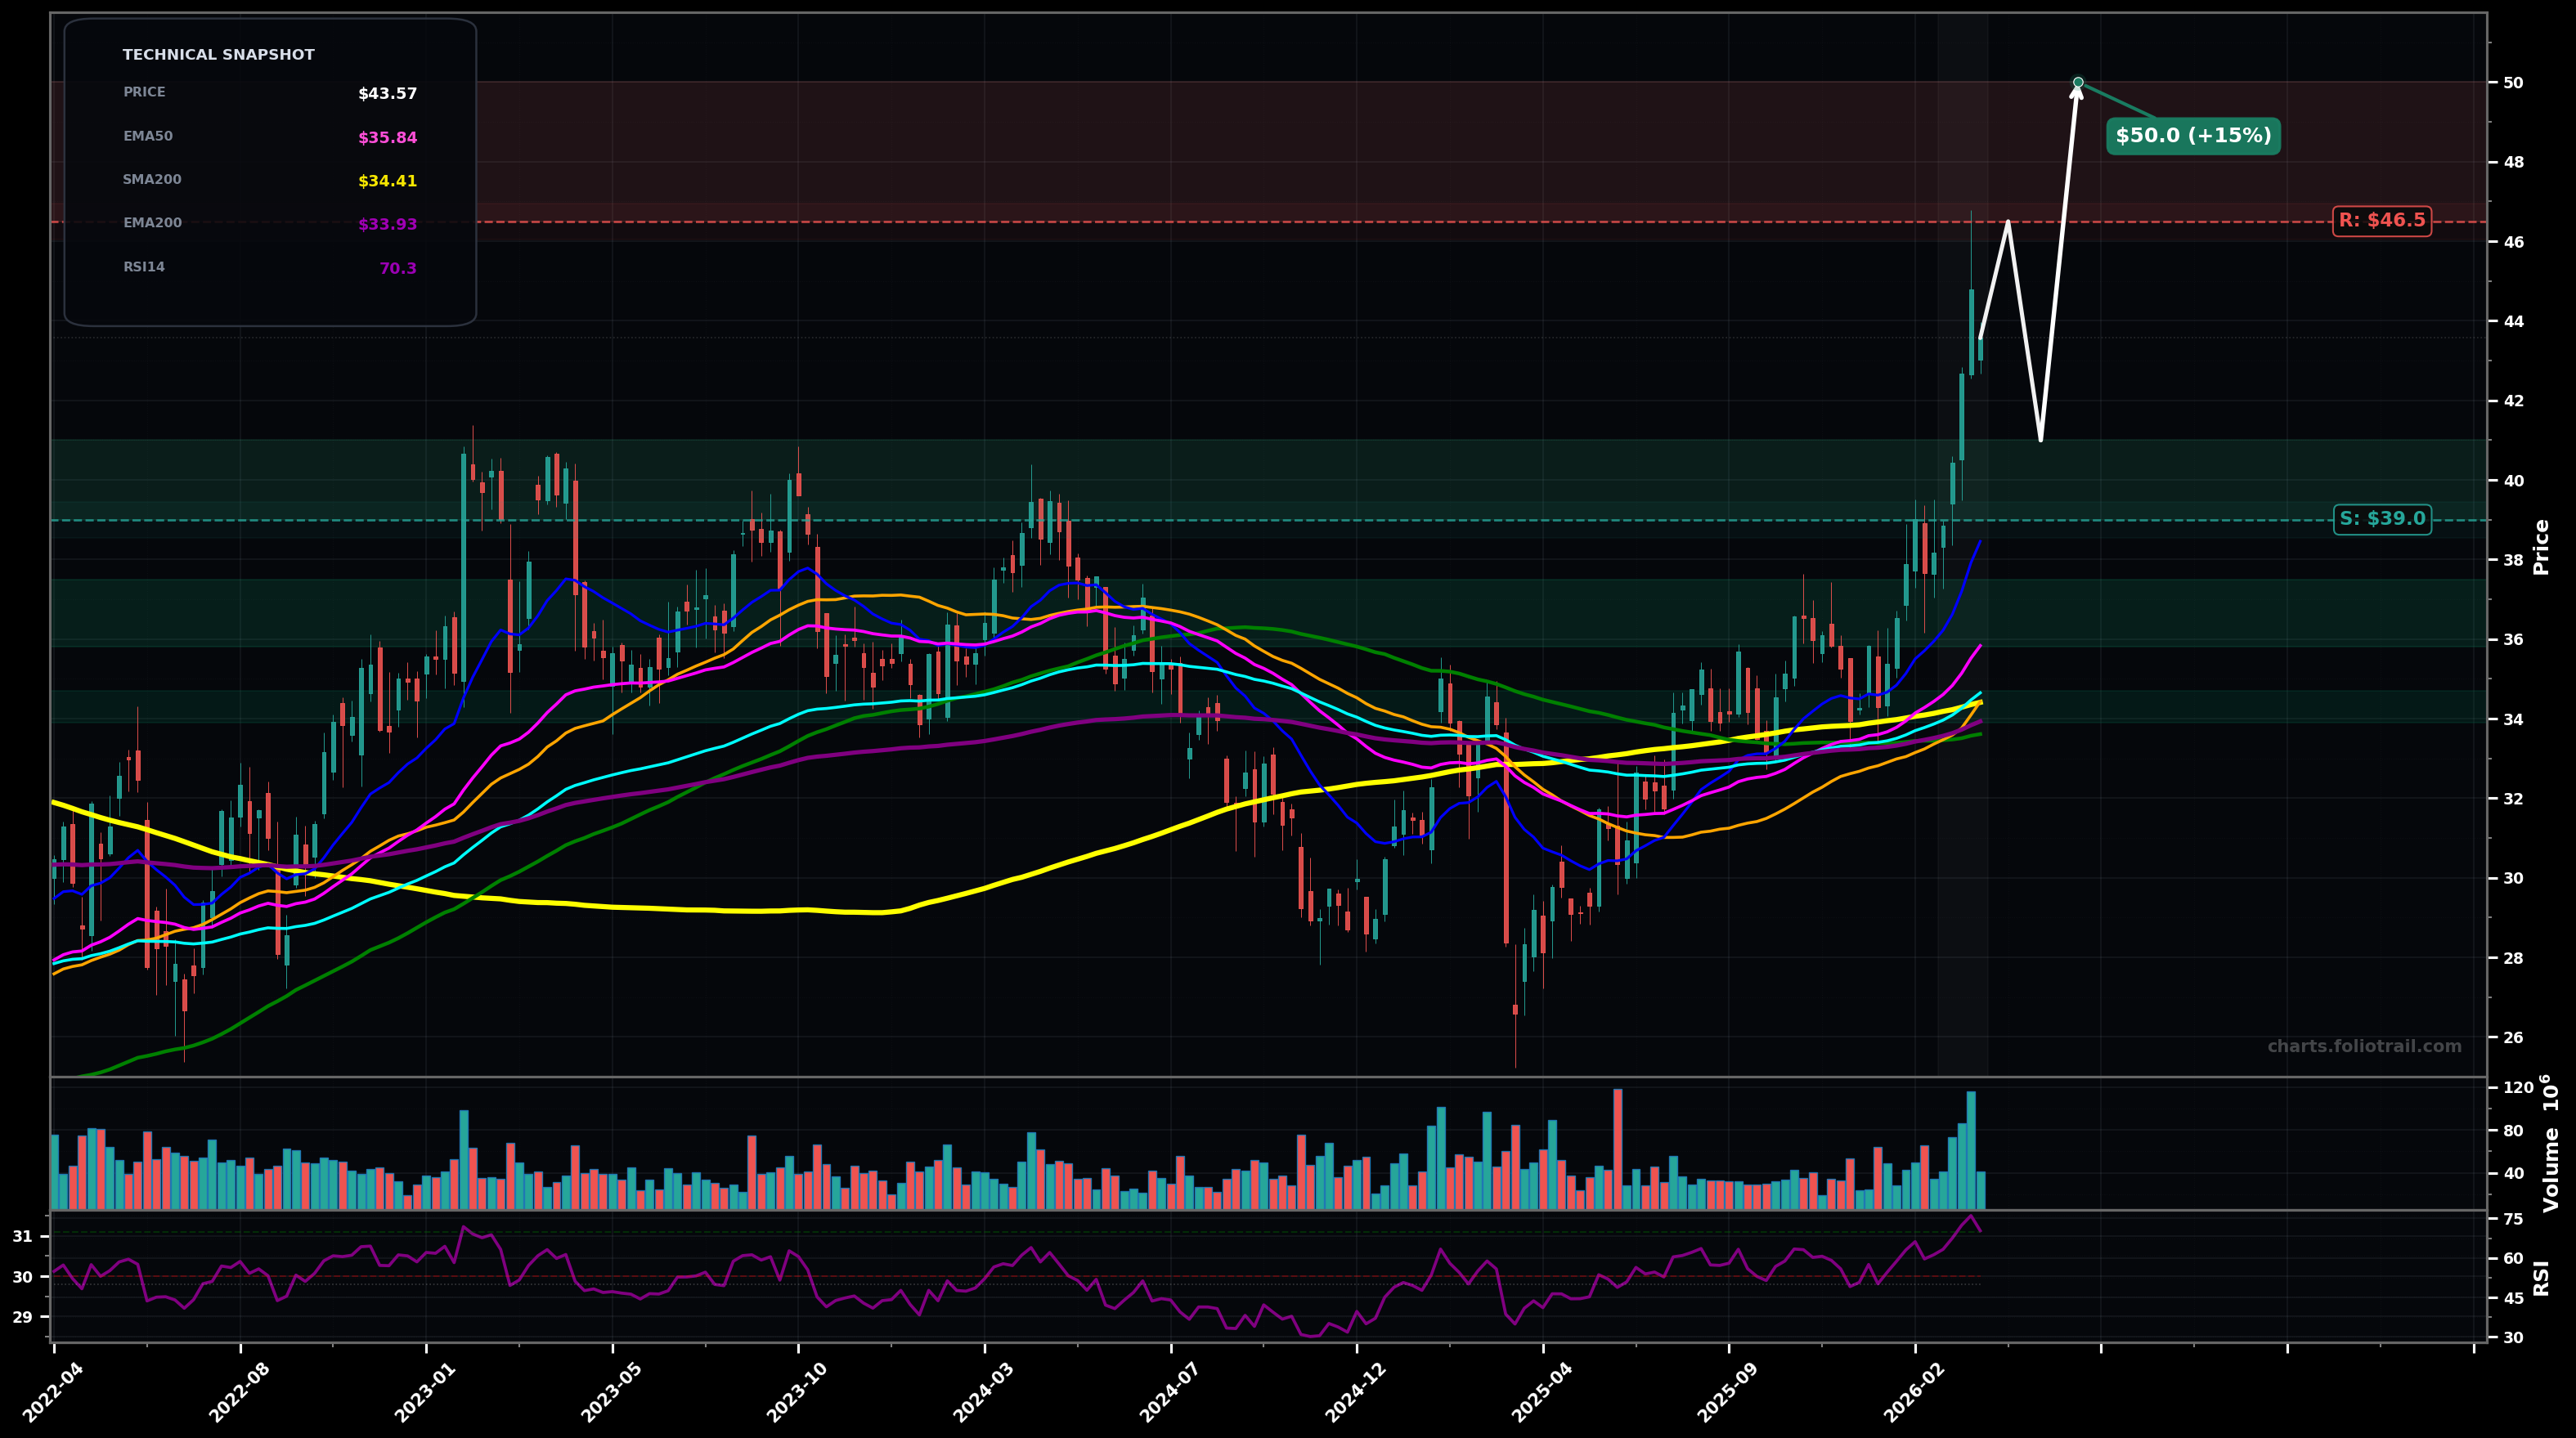
As of March 24, 2026, BP (BP p.l.c. Sponsored ADR) is in a parabolic state on the weekly chart, with a confidence level of 68%. Key support is at $39.0 and key resistance at $46.5. Weekly breakout with strong green expansion candles; price at $43.57 is extended above rising EMA50/EMA100 and all major SMAs; RSI(14) ~70 suggests short-term overbought.
Bullish continuation: brief digestion/pullback holds above prior breakout area, then trend resumes (Elliott: late Wave 3 / early Wave 5 behavior; Fib extension points to next magnet).
Bearish mean-reversion: parabolic leg cools into a deeper pullback toward rising MAs (Elliott: Wave 4-style retrace), but larger trend remains intact unless key support breaks.
2+ weekly closes above $44.00 with EMA50 continuing to rise
Weekly close back below $39.00 (loss of breakout and loss of the most recent acceleration structure)
Buy-the-dip framework: $39-$41 is prior breakout/near-term structure; $35.8-$37.5 aligns with EMA50/pullback zone; $33.9-$34.7 clusters EMA100 (cyan) + prior base congestion (MA confluence).
Trim into extension: first into prior swing/round-number resistance ($46.5-$50), then heavier trims on further Fib-extension/round-number stretch; full close only if price becomes multi-year stretched far above rising EMA50/100.
As of March 24, 2026, BP (BP p.l.c. Sponsored ADR) is in a parabolic state on the weekly chart with 68% confidence. Weekly breakout with strong green expansion candles; price at $43.57 is extended above rising EMA50/EMA100 and all major SMAs; RSI(14) ~70 suggests short-term overbought.
On the weekly timeframe, BP has key support at $39.0 and key resistance at $46.5. The most likely scenario (bullish) targets $46.5 and $50.0, with a revert level at $41.0.
BP (BP p.l.c. Sponsored ADR) is currently classified as parabolic on the weekly chart, with 68% confidence. Confirmation requires: 2+ weekly closes above $44.00 with EMA50 continuing to rise This would be invalidated by: Weekly close back below $39.00 (loss of breakout and loss of the most recent acceleration structure)
The most likely scenario (bullish) targets $46.5 and $50.0, with a revert level at $41.0. The alternative scenario (bearish) targets $39.0 and $35.8.
All content on this website — including charts, analysis, price targets, support/resistance levels, and position zones — is generated entirely by AI and provided for educational and informational purposes only.
This is not financial advice. NEXUSNOIR VENTURES SL (the operator of this website) is not a registered investment adviser or broker-dealer. You should not make investment decisions based solely on this information. Always do your own research and consult a qualified financial advisor.
By continuing, you acknowledge that you have read and agree to our full disclaimer & terms of use and privacy policy.