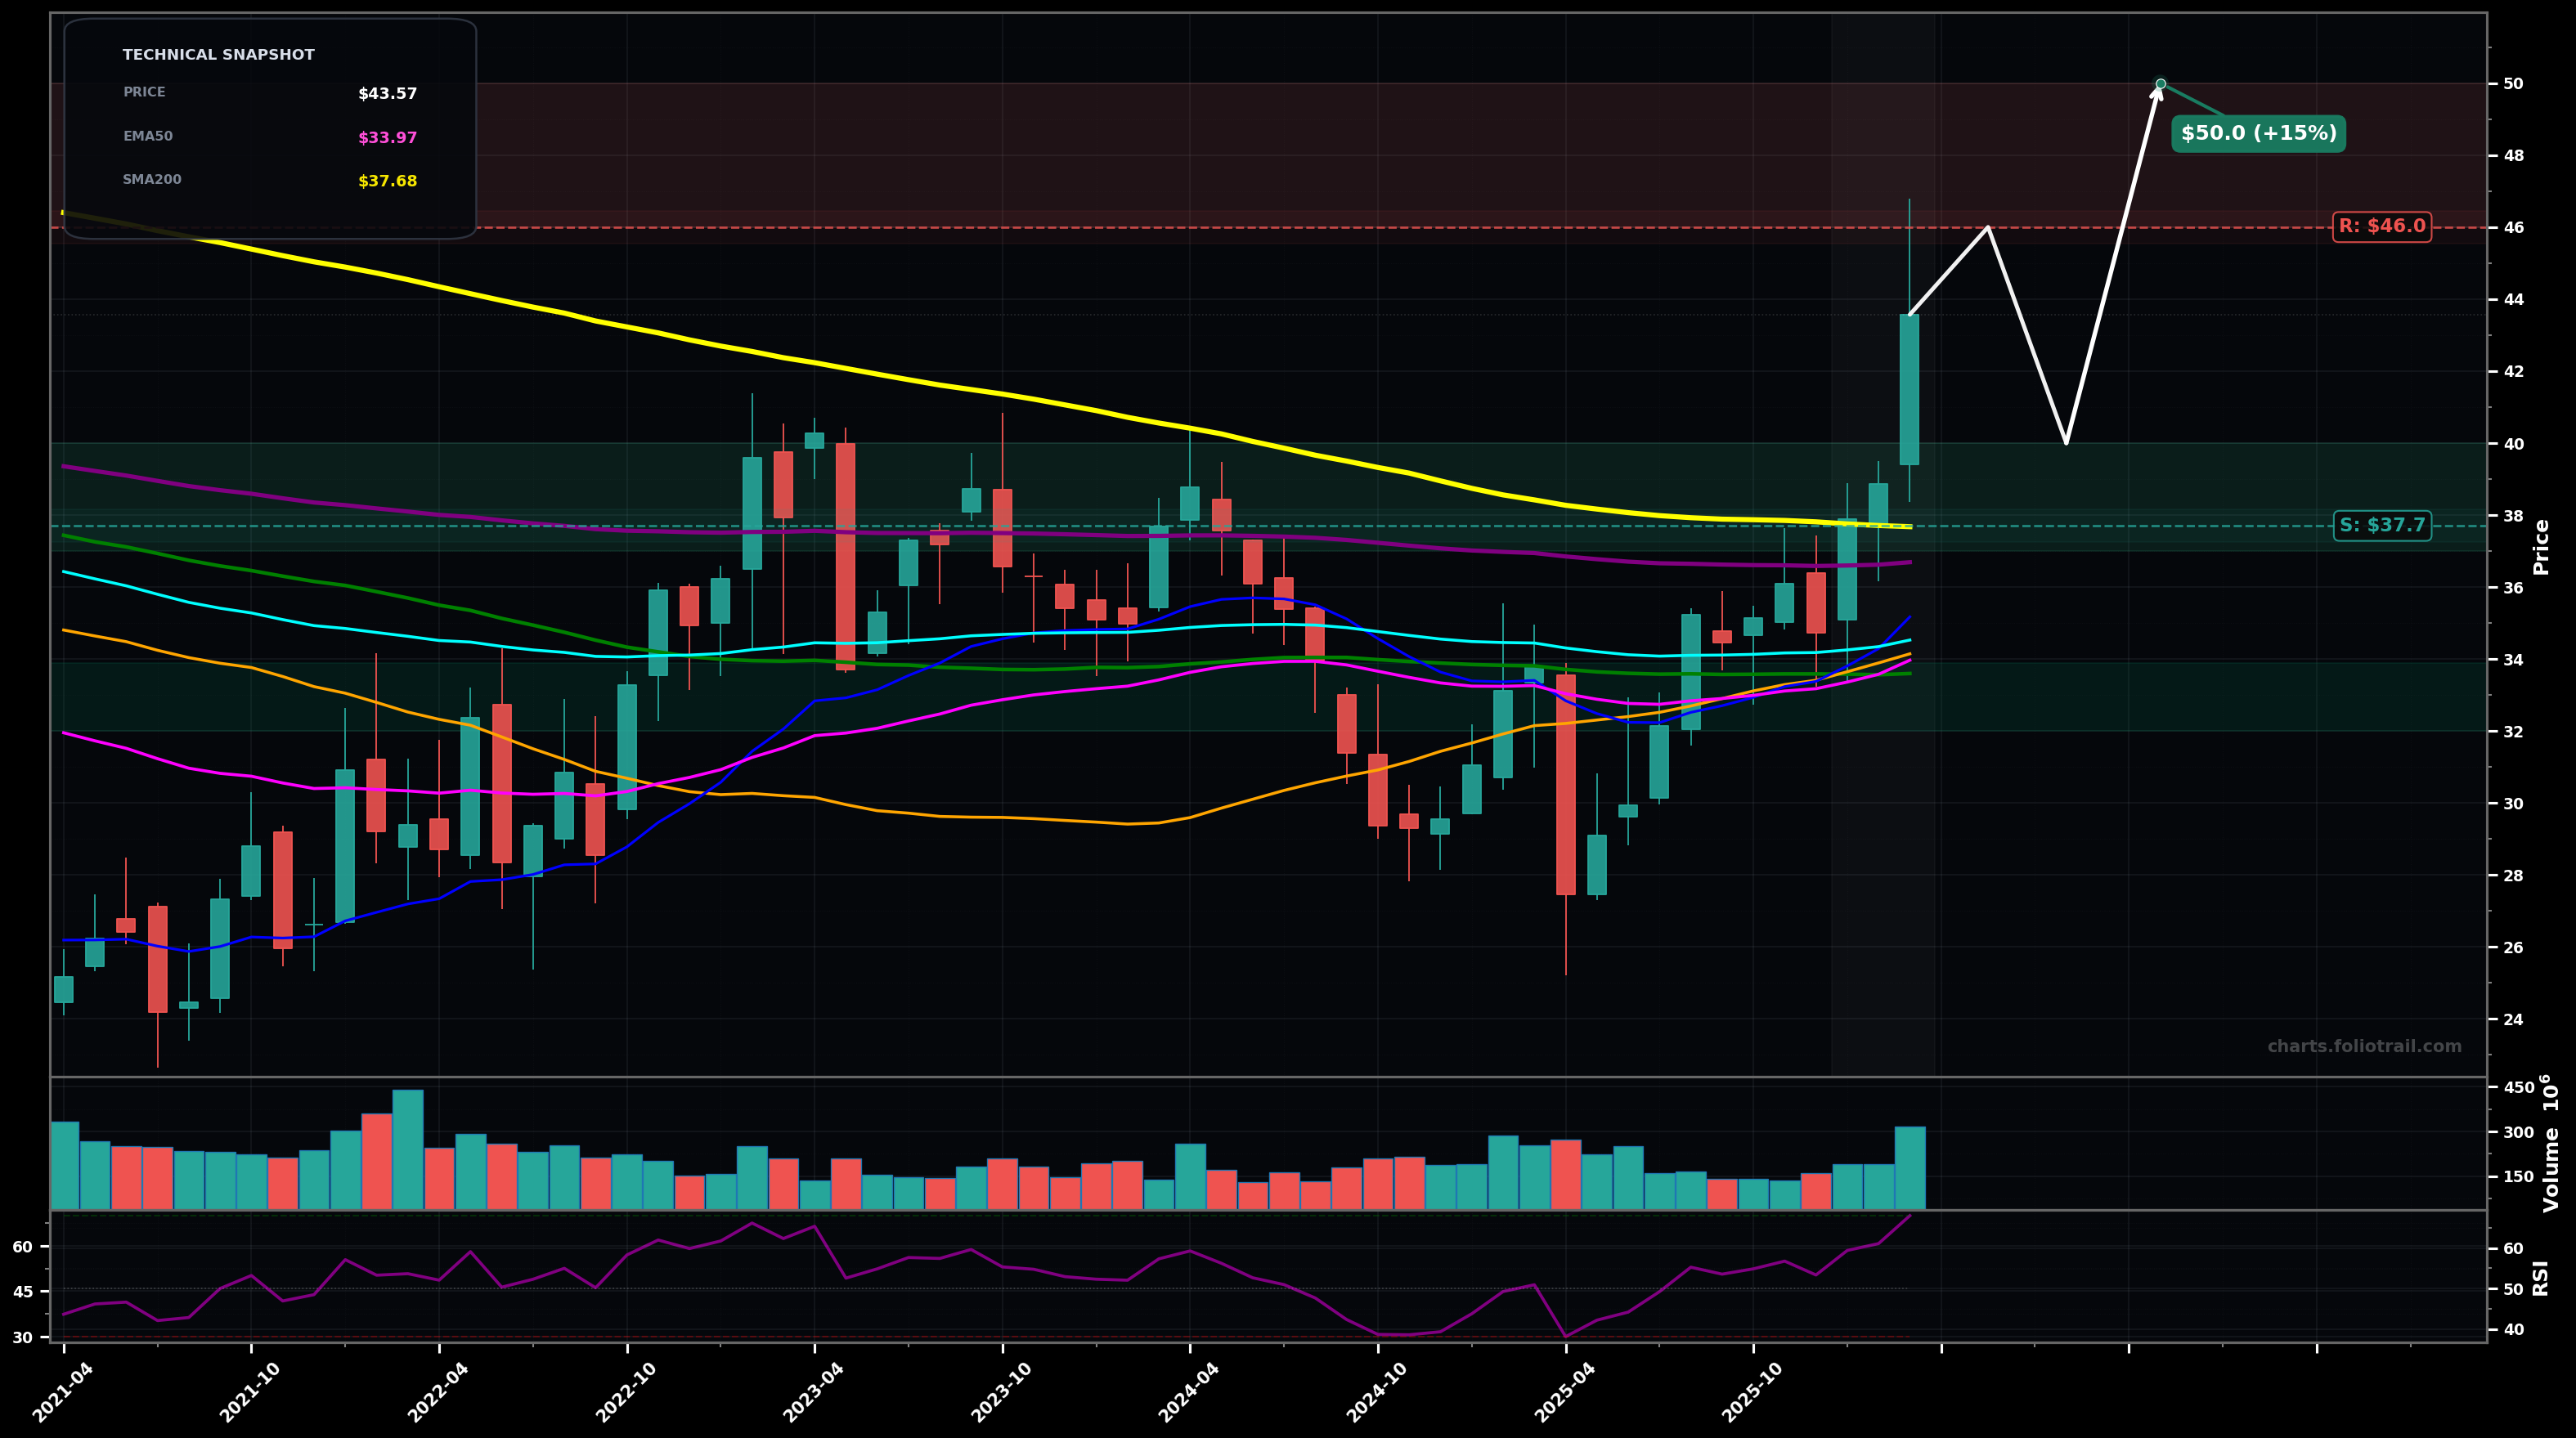
As of March 24, 2026, BP (BP p.l.c. Sponsored ADR) is in a breakout reversal state on the monthly chart, with a confidence level of 72%. Key support is at $37.7 and key resistance at $46.0. Monthly breakout with a large green impulse candle to ~$43.57, clearing the prior swing resistance area and reclaiming the long MAs; RSI ~68 suggests strong momentum but near extended.
Bullish continuation: a brief digestion/pullback holds above the reclaimed SMA200/EMA200 band, then a push toward the upper prior supply zone and breakout extension.
Bearish pullback: breakout fails near ~$46 and price mean-reverts to the EMA50/EMA100 cluster; structure remains constructive only if it prints a HL on the monthly.
Hold 2 monthly closes above ~$37.70 (SMA200) with pullbacks finding support above ~$36.70 (EMA200).
Monthly close back below ~$34.50 (EMA100) would negate the breakout-reversal structure.
Buy-the-dip plan centered on reclaimed SMA200/EMA200 support first, then EMA100/EMA50 cluster, with heavy adds only on a deeper monthly pullback into the prior base support.
Trim into prior multi-month supply (~$46+) and potential Fib extension zones; close more aggressively if price becomes stretched far above rising EMA50/100 with RSI staying elevated and momentum showing blow-off characteristics.
As of March 24, 2026, BP (BP p.l.c. Sponsored ADR) is in a breakout reversal state on the monthly chart with 72% confidence. Monthly breakout with a large green impulse candle to ~$43.57, clearing the prior swing resistance area and reclaiming the long MAs; RSI ~68 suggests strong momentum but near extended.
On the monthly timeframe, BP has key support at $37.7 and key resistance at $46.0. The most likely scenario (bullish) targets $46.0 and $50.0, with a revert level at $40.0.
BP (BP p.l.c. Sponsored ADR) is currently classified as breakout reversal on the monthly chart, with 72% confidence. Confirmation requires: Hold 2 monthly closes above ~$37.70 (SMA200) with pullbacks finding support above ~$36.70 (EMA200). This would be invalidated by: Monthly close back below ~$34.50 (EMA100) would negate the breakout-reversal structure.
The most likely scenario (bullish) targets $46.0 and $50.0, with a revert level at $40.0. The alternative scenario (bearish) targets $36.7 and $33.9.
All content on this website — including charts, analysis, price targets, support/resistance levels, and position zones — is generated entirely by AI and provided for educational and informational purposes only.
This is not financial advice. NEXUSNOIR VENTURES SL (the operator of this website) is not a registered investment adviser or broker-dealer. You should not make investment decisions based solely on this information. Always do your own research and consult a qualified financial advisor.
By continuing, you acknowledge that you have read and agree to our full disclaimer & terms of use and privacy policy.