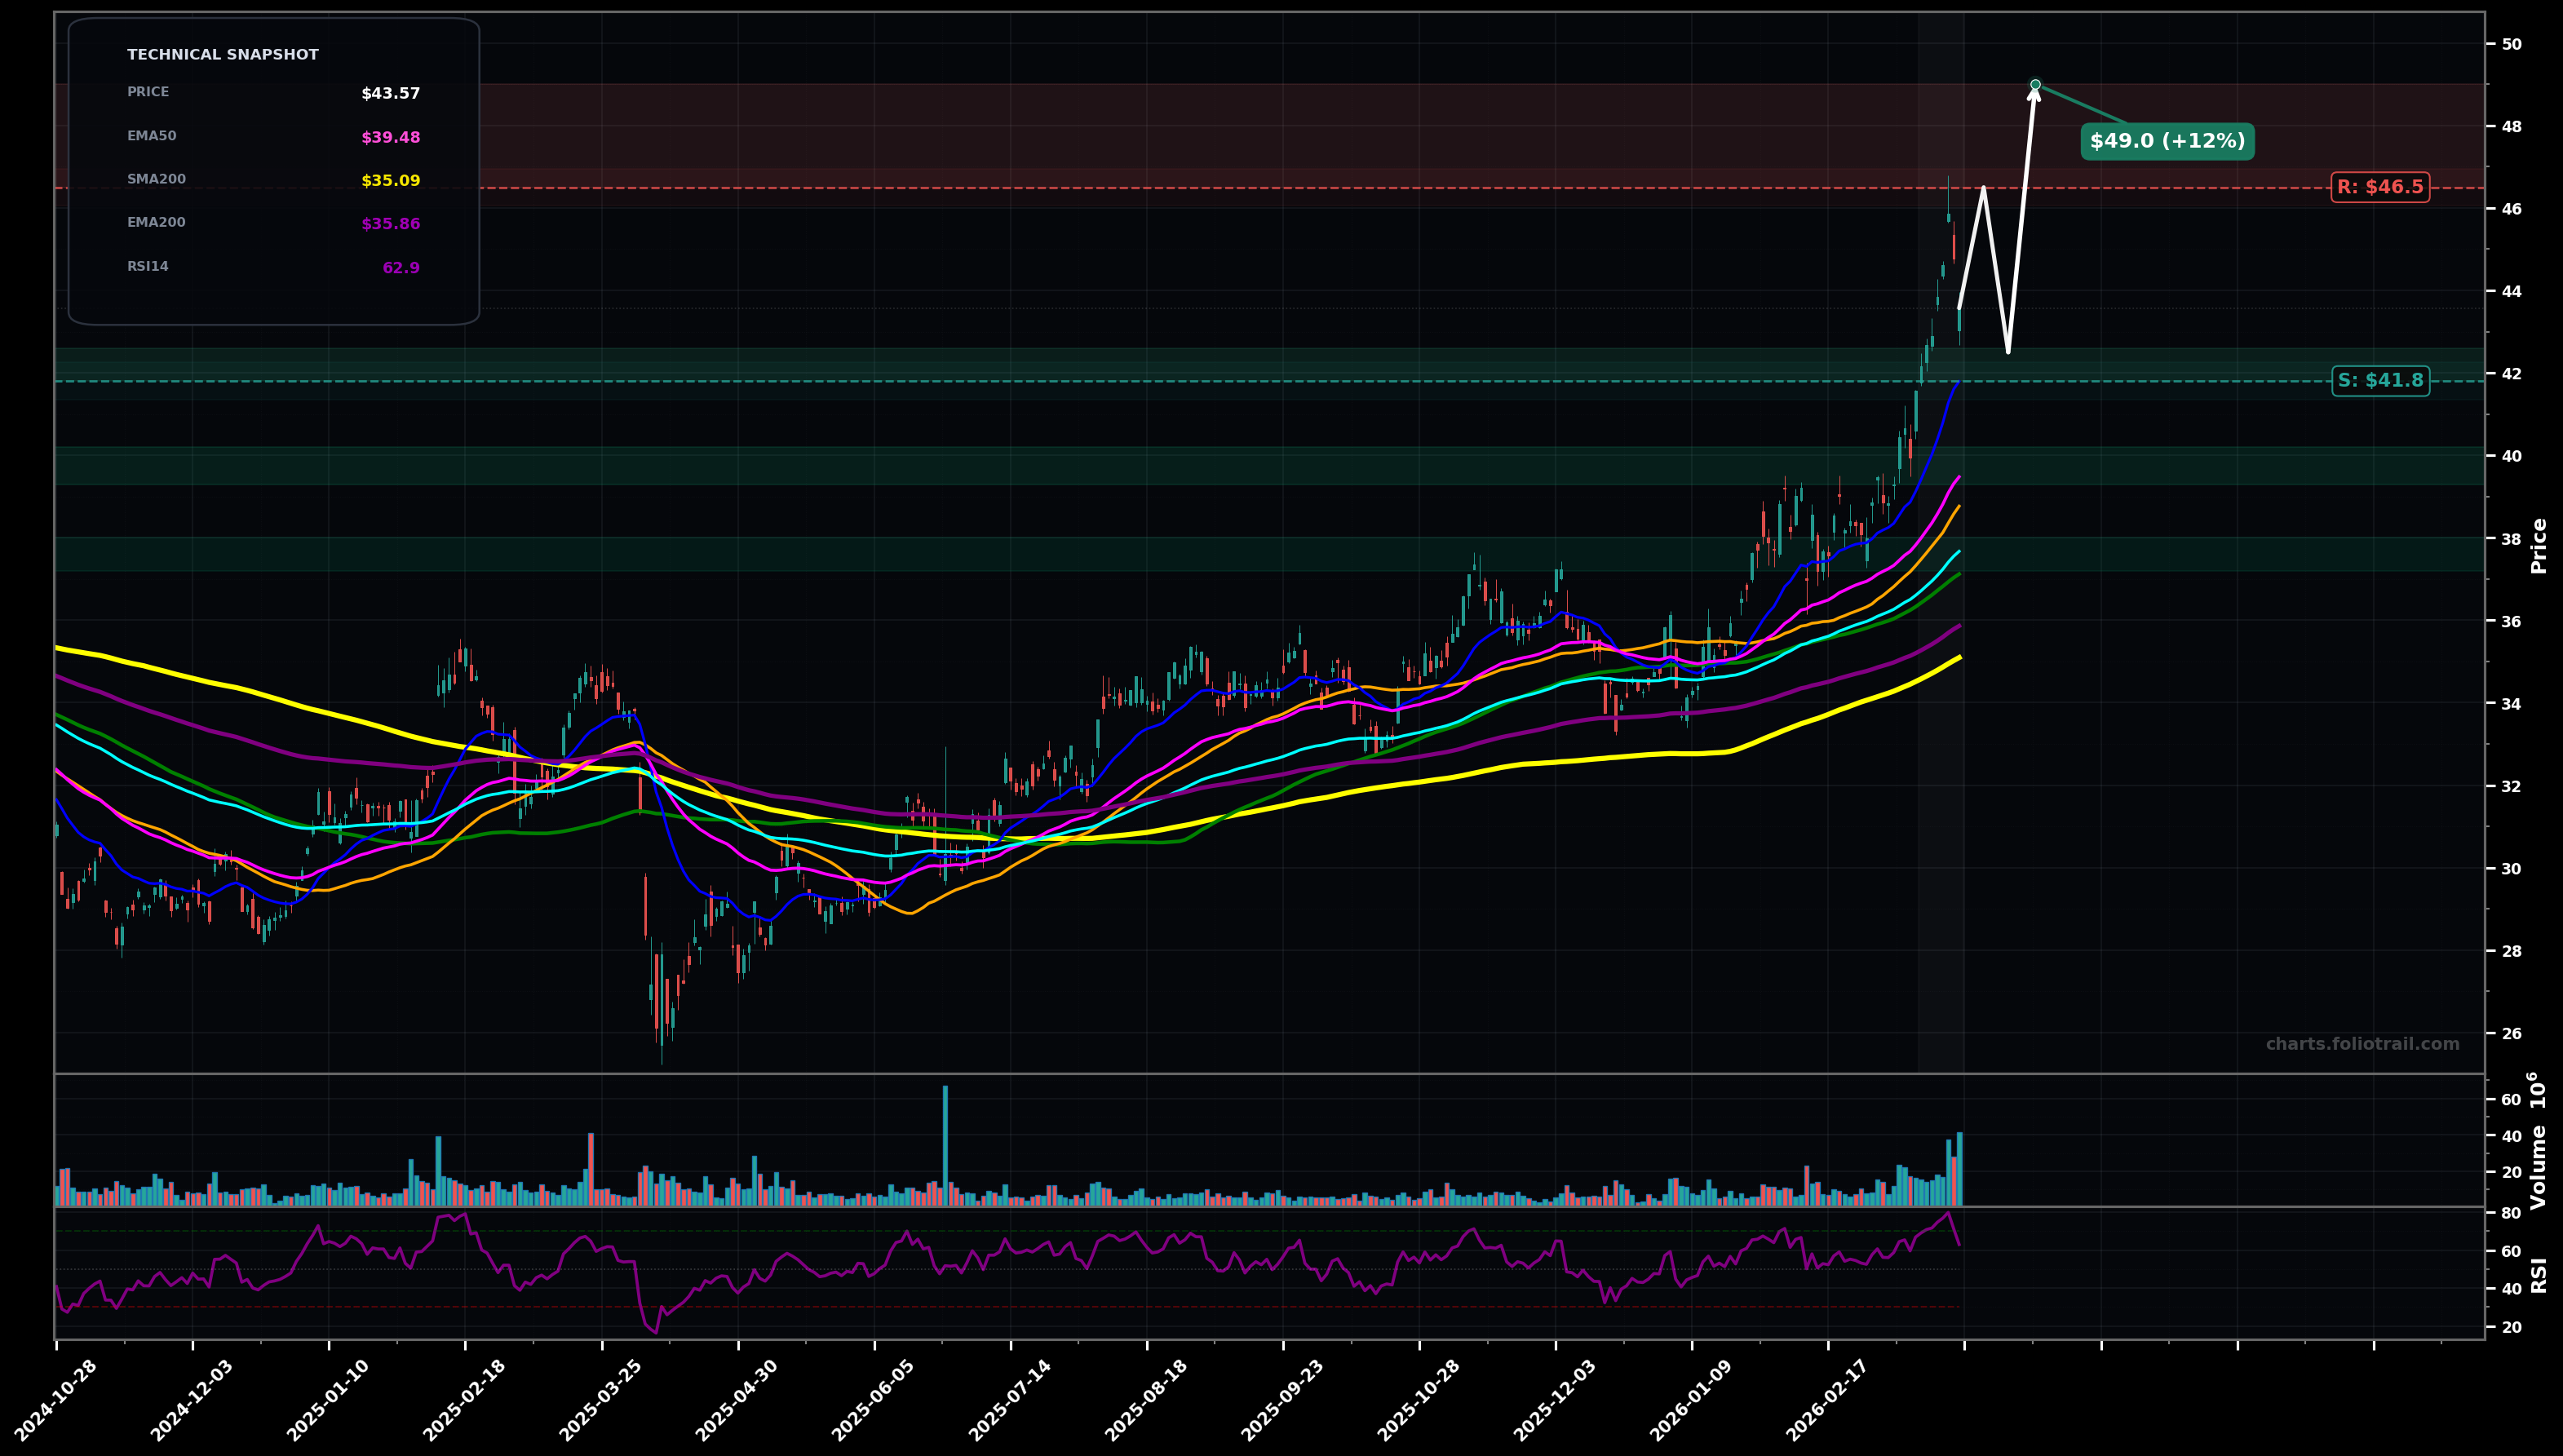
As of March 24, 2026, BP (BP p.l.c. Sponsored ADR) is in a parabolic state on the daily chart, with a confidence level of 72%. Key support is at $41.8 and key resistance at $46.5. Strong breakout from the prior range with a steep HH/HL push; price extended above all key MAs after a high-volume surge, now printing a small pullback candle near the top.
Bullish continuation after a brief digestion: pullback holds above the prior breakout zone (~$41.8–$42.5), then resumes trend and re-tests the recent high before pushing higher.
Deeper mean-reversion: parabolic leg unwinds into a larger ABC-style correction (Elliott Wave: Wave 4 / corrective phase) toward the rising EMA50/EMA100 cluster, then attempts a new base.
2+ daily closes above $45.00 while holding above EMA50 (~$39.50).
Daily close below $41.80 (loss of the recent breakout shelf and undercut of short-term trend support).
Buy-the-dip structure: start at breakout retest (~$42), add at EMA50 area (~$39.5), heavy add near EMA100/structure support (~$37.7) if correction deepens.
Trend is extended from EMA50/EMA100; trimming into $46.5+ helps manage parabolic reversal risk, with heavier trims if price pushes into successive extension zones.
As of March 24, 2026, BP (BP p.l.c. Sponsored ADR) is in a parabolic state on the daily chart with 72% confidence. Strong breakout from the prior range with a steep HH/HL push; price extended above all key MAs after a high-volume surge, now printing a small pullback candle near the top.
On the daily timeframe, BP has key support at $41.8 and key resistance at $46.5. The most likely scenario (bullish) targets $46.5 and $49.0, with a revert level at $42.5.
BP (BP p.l.c. Sponsored ADR) is currently classified as parabolic on the daily chart, with 72% confidence. Confirmation requires: 2+ daily closes above $45.00 while holding above EMA50 (~$39.50). This would be invalidated by: Daily close below $41.80 (loss of the recent breakout shelf and undercut of short-term trend support).
The most likely scenario (bullish) targets $46.5 and $49.0, with a revert level at $42.5. The alternative scenario (bearish) targets $39.5 and $37.7.
All content on this website — including charts, analysis, price targets, support/resistance levels, and position zones — is generated entirely by AI and provided for educational and informational purposes only.
This is not financial advice. NEXUSNOIR VENTURES SL (the operator of this website) is not a registered investment adviser or broker-dealer. You should not make investment decisions based solely on this information. Always do your own research and consult a qualified financial advisor.
By continuing, you acknowledge that you have read and agree to our full disclaimer & terms of use and privacy policy.