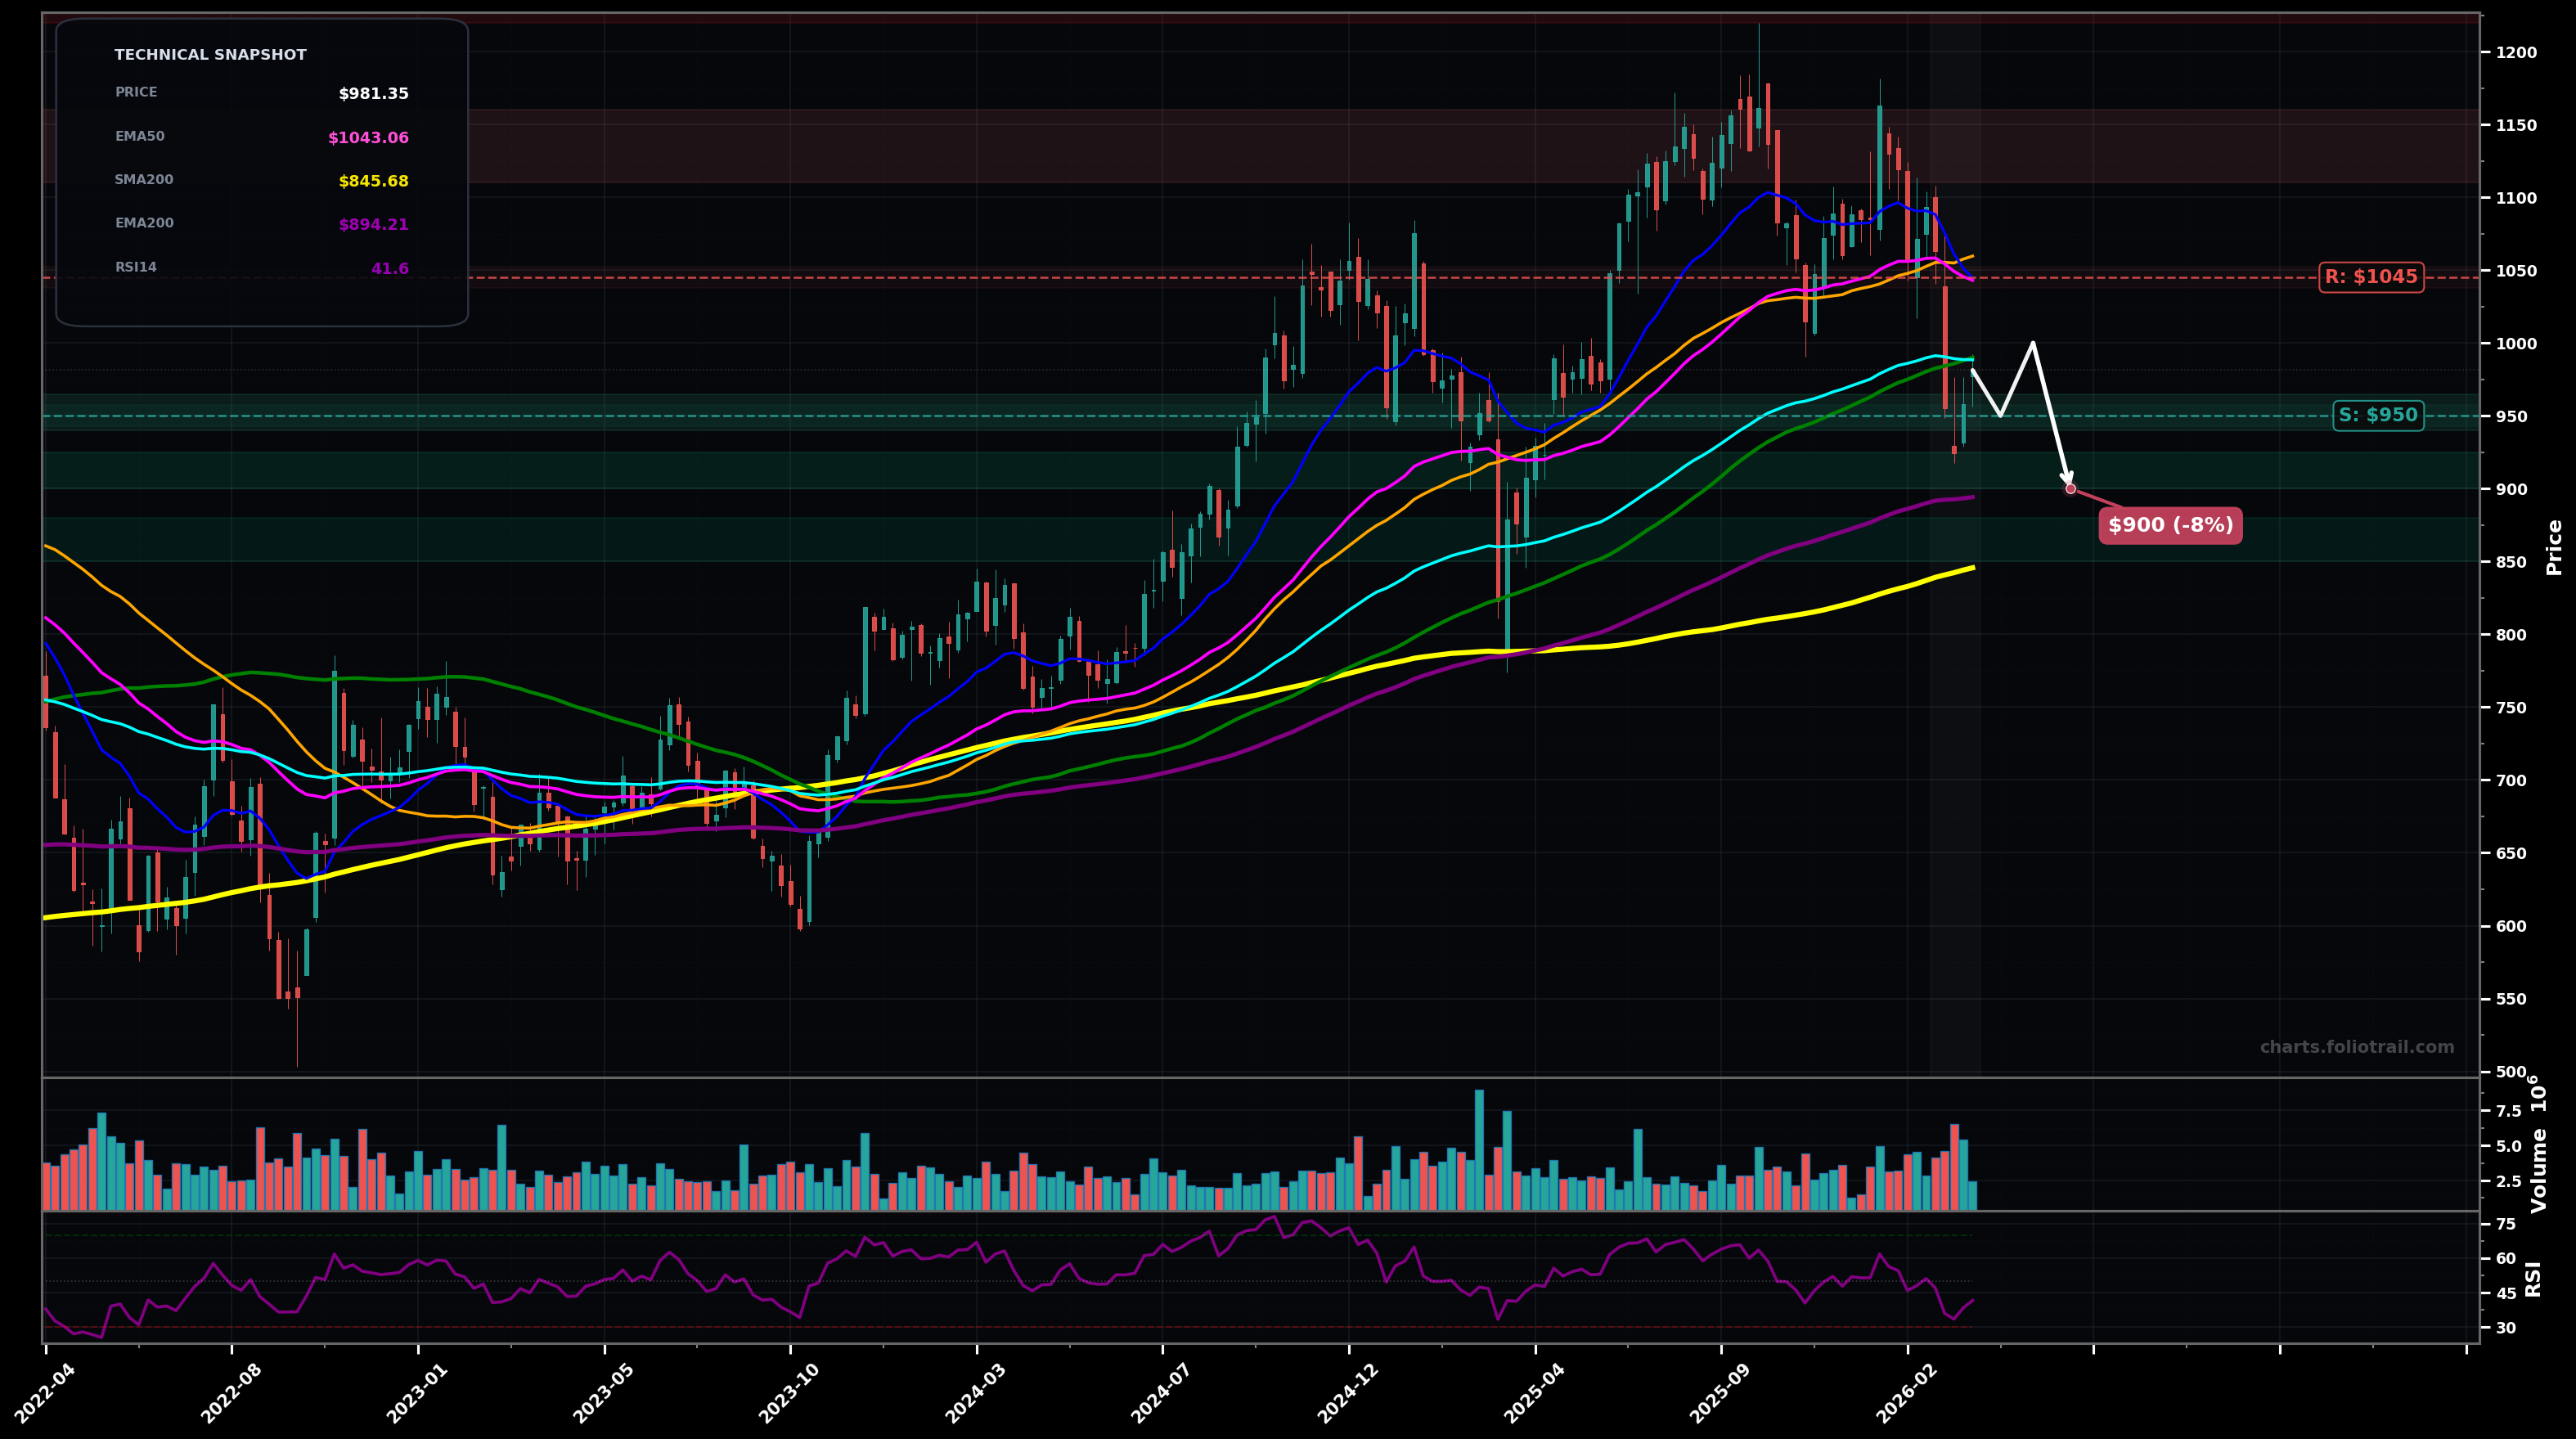
As of March 26, 2026, BLK (BlackRock, Inc.) is in a downtrend state on the weekly chart, with a confidence level of 68%. Key support is at $950 and key resistance at $1045. Weekly selloff from the $1,150–$1,200 zone broke below the $1,000 area; price ($981.35) is now under EMA50/EMA100 and attempting a small bounce back toward the moving-average cluster.
Bearish continuation (likely Wave C of a larger ABC correction from the $1,200 top): drift/lower into the $950 support, then probe toward the larger confluence zone around the rising SMA100/EMA100 region and prior structure near $900; a bounce attempt could occur on first touch.
Bullish reversal attempt (ending diagonal/ABC completion): hold $950 and reclaim the MA cluster; if price regains EMA50/SMA100 area it can squeeze back toward the broken support-turned-resistance around $1,090–$1,110 (typical 38.2%–50% retrace of the drop).
Confirm downtrend continuation on a weekly close below $950.
Invalidate if weekly closes reclaim and hold above $1,045 (2+ closes) with follow-through.
Start near first swing support ($950); add on breakdown/retest toward prior pivot + EMA200 ($894)/round-number $900; heavy add near SMA200 ($846) as higher-timeframe mean-reversion support.
Trim into prior distribution highs and fib retrace resistance ($1,110–$1,220); close into a full retest/extension above the prior ATH zone where upside becomes more stretched vs long MAs.
As of March 26, 2026, BLK (BlackRock, Inc.) is in a downtrend state on the weekly chart with 68% confidence. Weekly selloff from the $1,150–$1,200 zone broke below the $1,000 area; price ($981.35) is now under EMA50/EMA100 and attempting a small bounce back toward the moving-average cluster.
On the weekly timeframe, BLK has key support at $950 and key resistance at $1045. The most likely scenario (bearish) targets $950 and $900, with a revert level at $1000.
BLK (BlackRock, Inc.) is currently classified as downtrend on the weekly chart, with 68% confidence. Confirmation requires: Confirm downtrend continuation on a weekly close below $950. This would be invalidated by: Invalidate if weekly closes reclaim and hold above $1,045 (2+ closes) with follow-through.
The most likely scenario (bearish) targets $950 and $900, with a revert level at $1000. The alternative scenario (bullish) targets $1045 and $1110.
Multi-layer AI agents analyse 200+ stocks across daily, weekly, and monthly timeframes — producing market state classifications, price scenarios with targets, and position entry/exit levels. Updated every trading day after market close. No paywall. No sign-up required.
Built by Foliotrail.
All content on this website — including charts, analysis, price targets, support/resistance levels, and position zones — is generated entirely by AI and provided for educational and informational purposes only.
This is not financial advice. NEXUSNOIR VENTURES SL (the operator of this website) is not a registered investment adviser or broker-dealer. You should not make investment decisions based solely on this information. Always do your own research and consult a qualified financial advisor.
By continuing, you acknowledge that you have read and agree to our full disclaimer & terms of use and privacy policy.