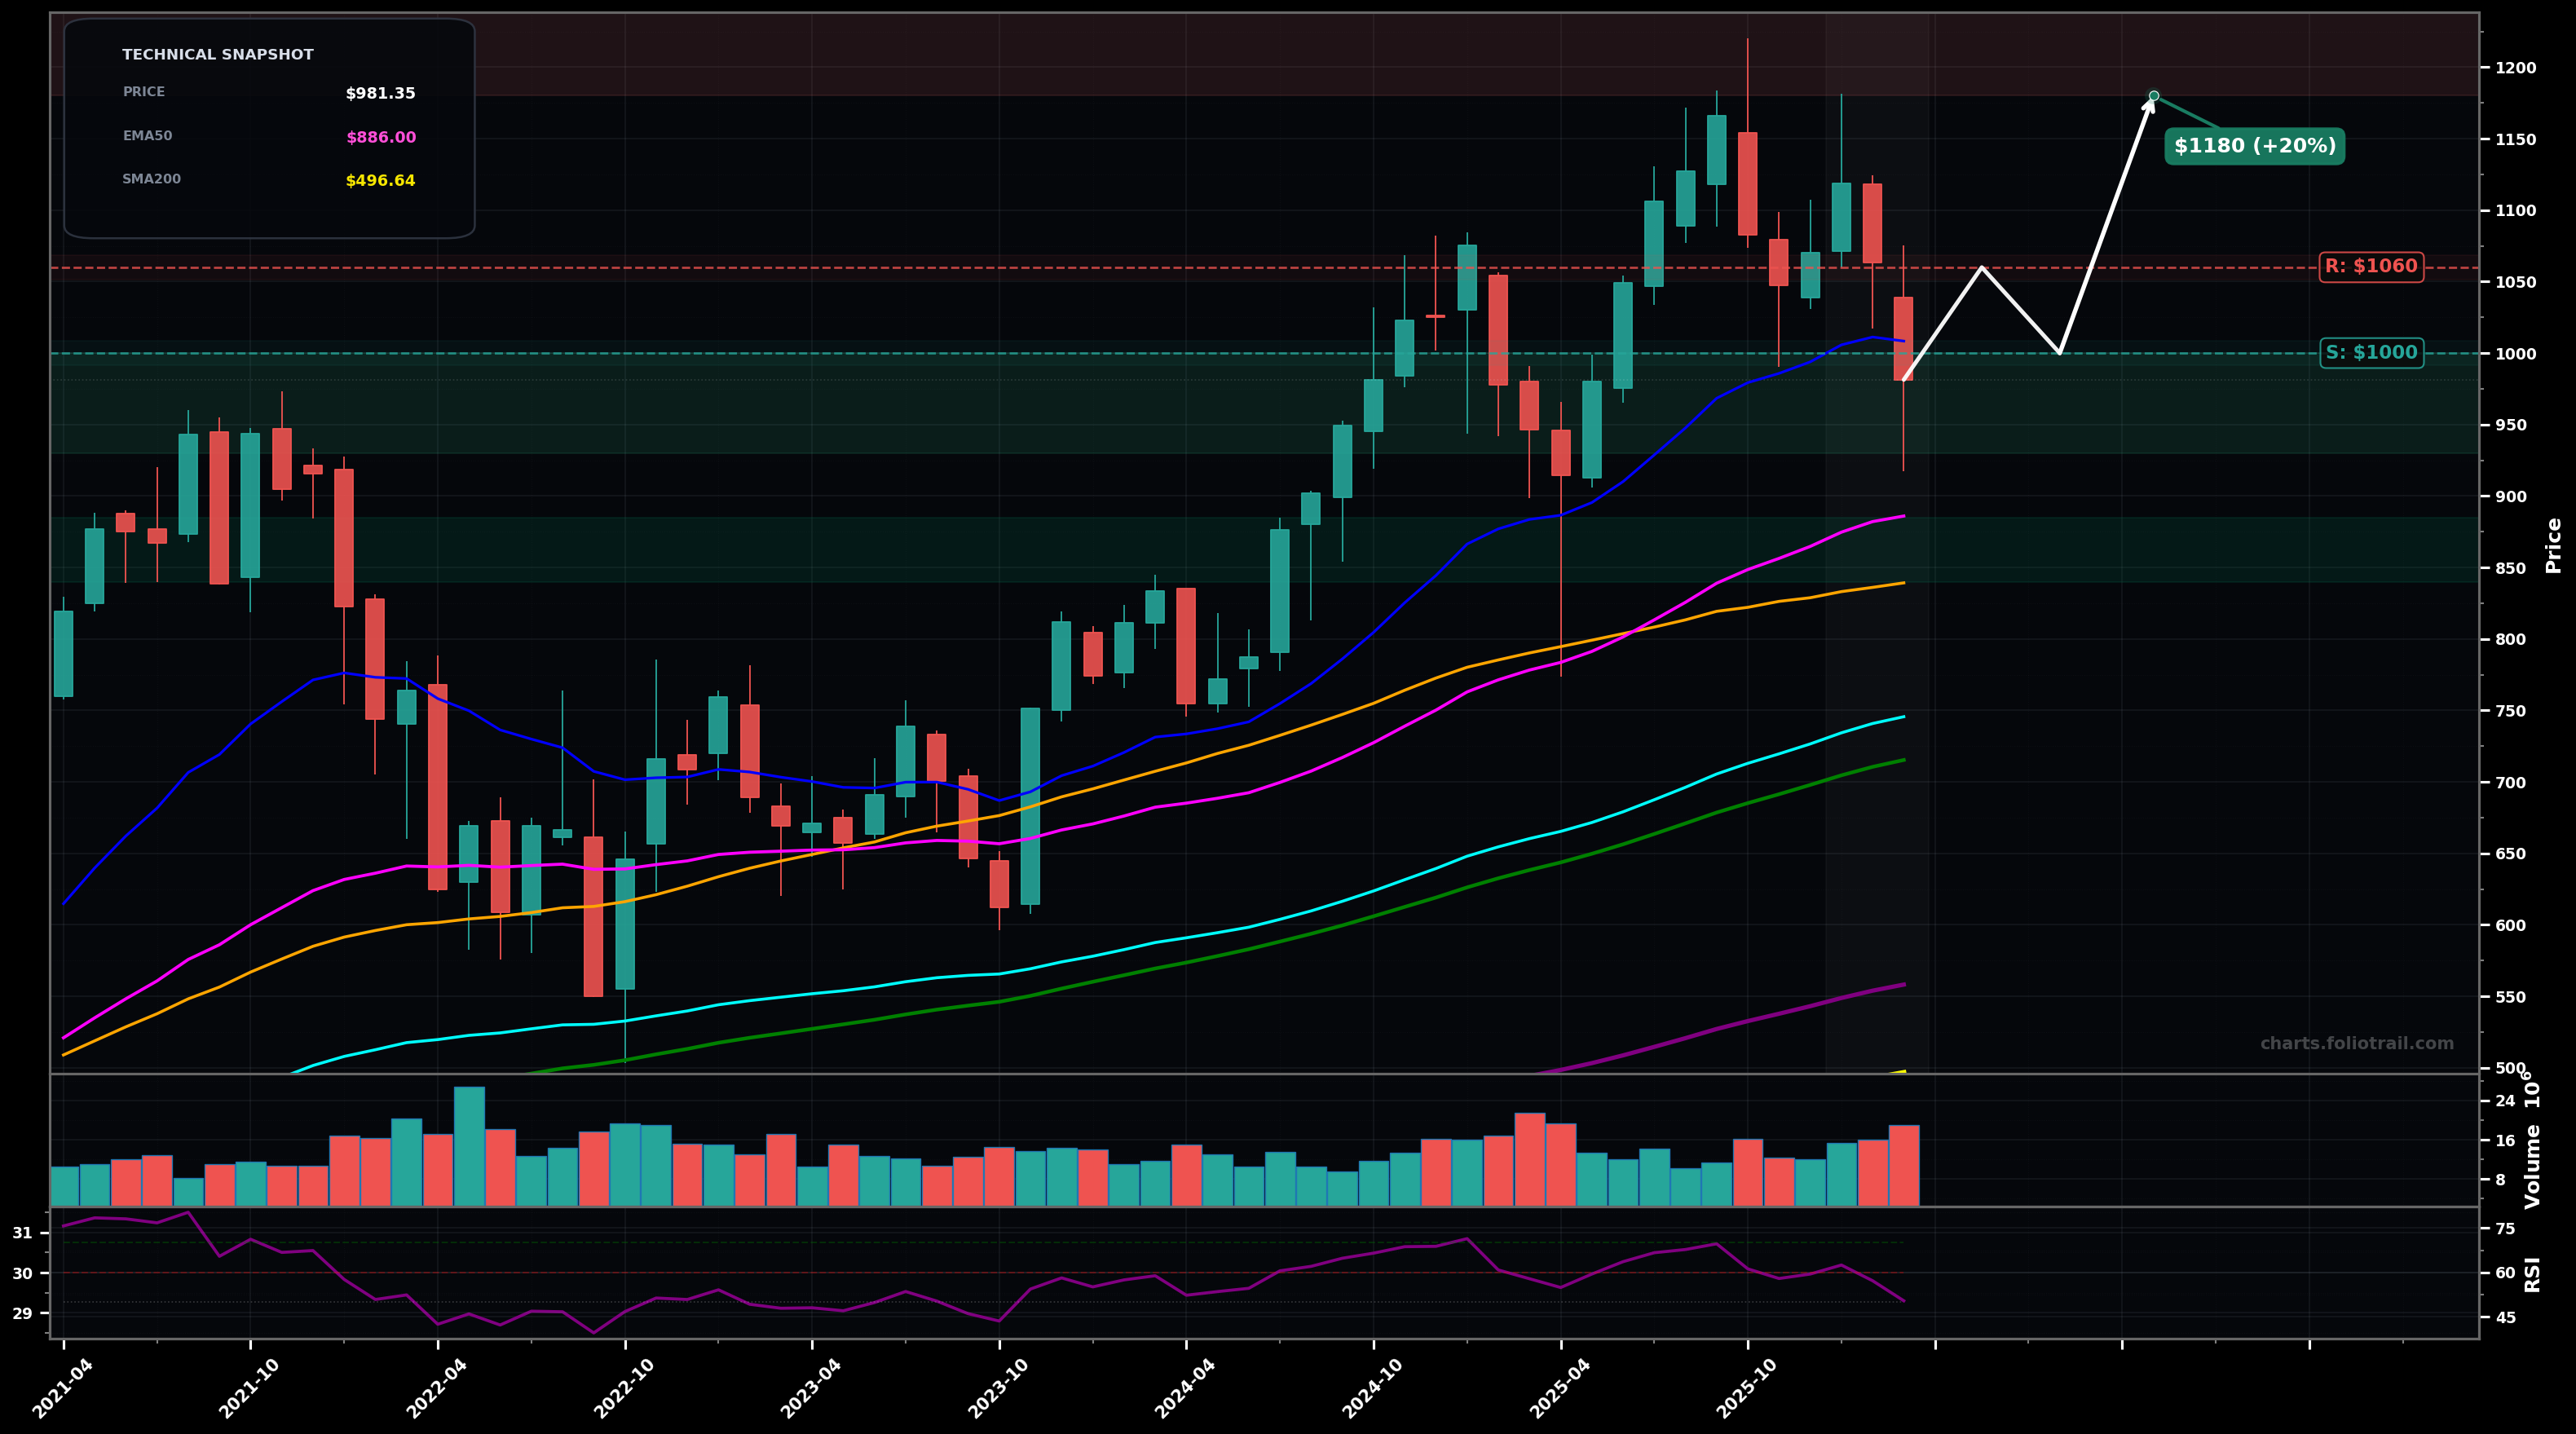
As of March 26, 2026, BLK (BlackRock, Inc.) is in a uptrend state on the monthly chart, with a confidence level of 64%. Key support is at $1000 and key resistance at $1060. Monthly pullback from the ~$1,180–$1,200 area; last candle is a strong red drop toward ~$1,000 while still above rising EMA50/SMA50.
Bullish continuation: price holds the $1,000 psychological/support shelf, then reclaims $1,060 and grinds back toward the prior peak zone; fits an Elliott Wave view of a corrective wave (4) completing before a wave (5) attempt.
Deeper correction: failure to reclaim $1,060 leads to another leg down (likely an ABC), testing the rising EMA50/SMA50 confluence; if volatility expands, a wick toward ~$840 becomes plausible before buyers step in.
Monthly close back above $1,060 (reclaim prior breakdown zone) would confirm the uptrend resuming
Monthly close below $886 (EMA50 pink) would invalidate the clean uptrend state and shift to deeper correction risk
Scale near the $1,000 pivot first, then add into EMA50 (~$886) + SMA50 (~$839) rising-trend confluence if the correction extends.
Trim into prior peak/extension zones where wave (5) and fib extensions typically exhaust, especially if monthly RSI pushes back above ~70 and price stretches far above EMA50.
As of March 26, 2026, BLK (BlackRock, Inc.) is in a uptrend state on the monthly chart with 64% confidence. Monthly pullback from the ~$1,180–$1,200 area; last candle is a strong red drop toward ~$1,000 while still above rising EMA50/SMA50.
On the monthly timeframe, BLK has key support at $1000 and key resistance at $1060. The most likely scenario (bullish) targets $1060 and $1180, with a revert level at $1000.
BLK (BlackRock, Inc.) is currently classified as uptrend on the monthly chart, with 64% confidence. Confirmation requires: Monthly close back above $1,060 (reclaim prior breakdown zone) would confirm the uptrend resuming This would be invalidated by: Monthly close below $886 (EMA50 pink) would invalidate the clean uptrend state and shift to deeper correction risk
The most likely scenario (bullish) targets $1060 and $1180, with a revert level at $1000. The alternative scenario (bearish) targets $900 and $840.
Multi-layer AI agents analyse 200+ stocks across daily, weekly, and monthly timeframes — producing market state classifications, price scenarios with targets, and position entry/exit levels. Updated every trading day after market close. No paywall. No sign-up required.
Built by Foliotrail.
All content on this website — including charts, analysis, price targets, support/resistance levels, and position zones — is generated entirely by AI and provided for educational and informational purposes only.
This is not financial advice. NEXUSNOIR VENTURES SL (the operator of this website) is not a registered investment adviser or broker-dealer. You should not make investment decisions based solely on this information. Always do your own research and consult a qualified financial advisor.
By continuing, you acknowledge that you have read and agree to our full disclaimer & terms of use and privacy policy.