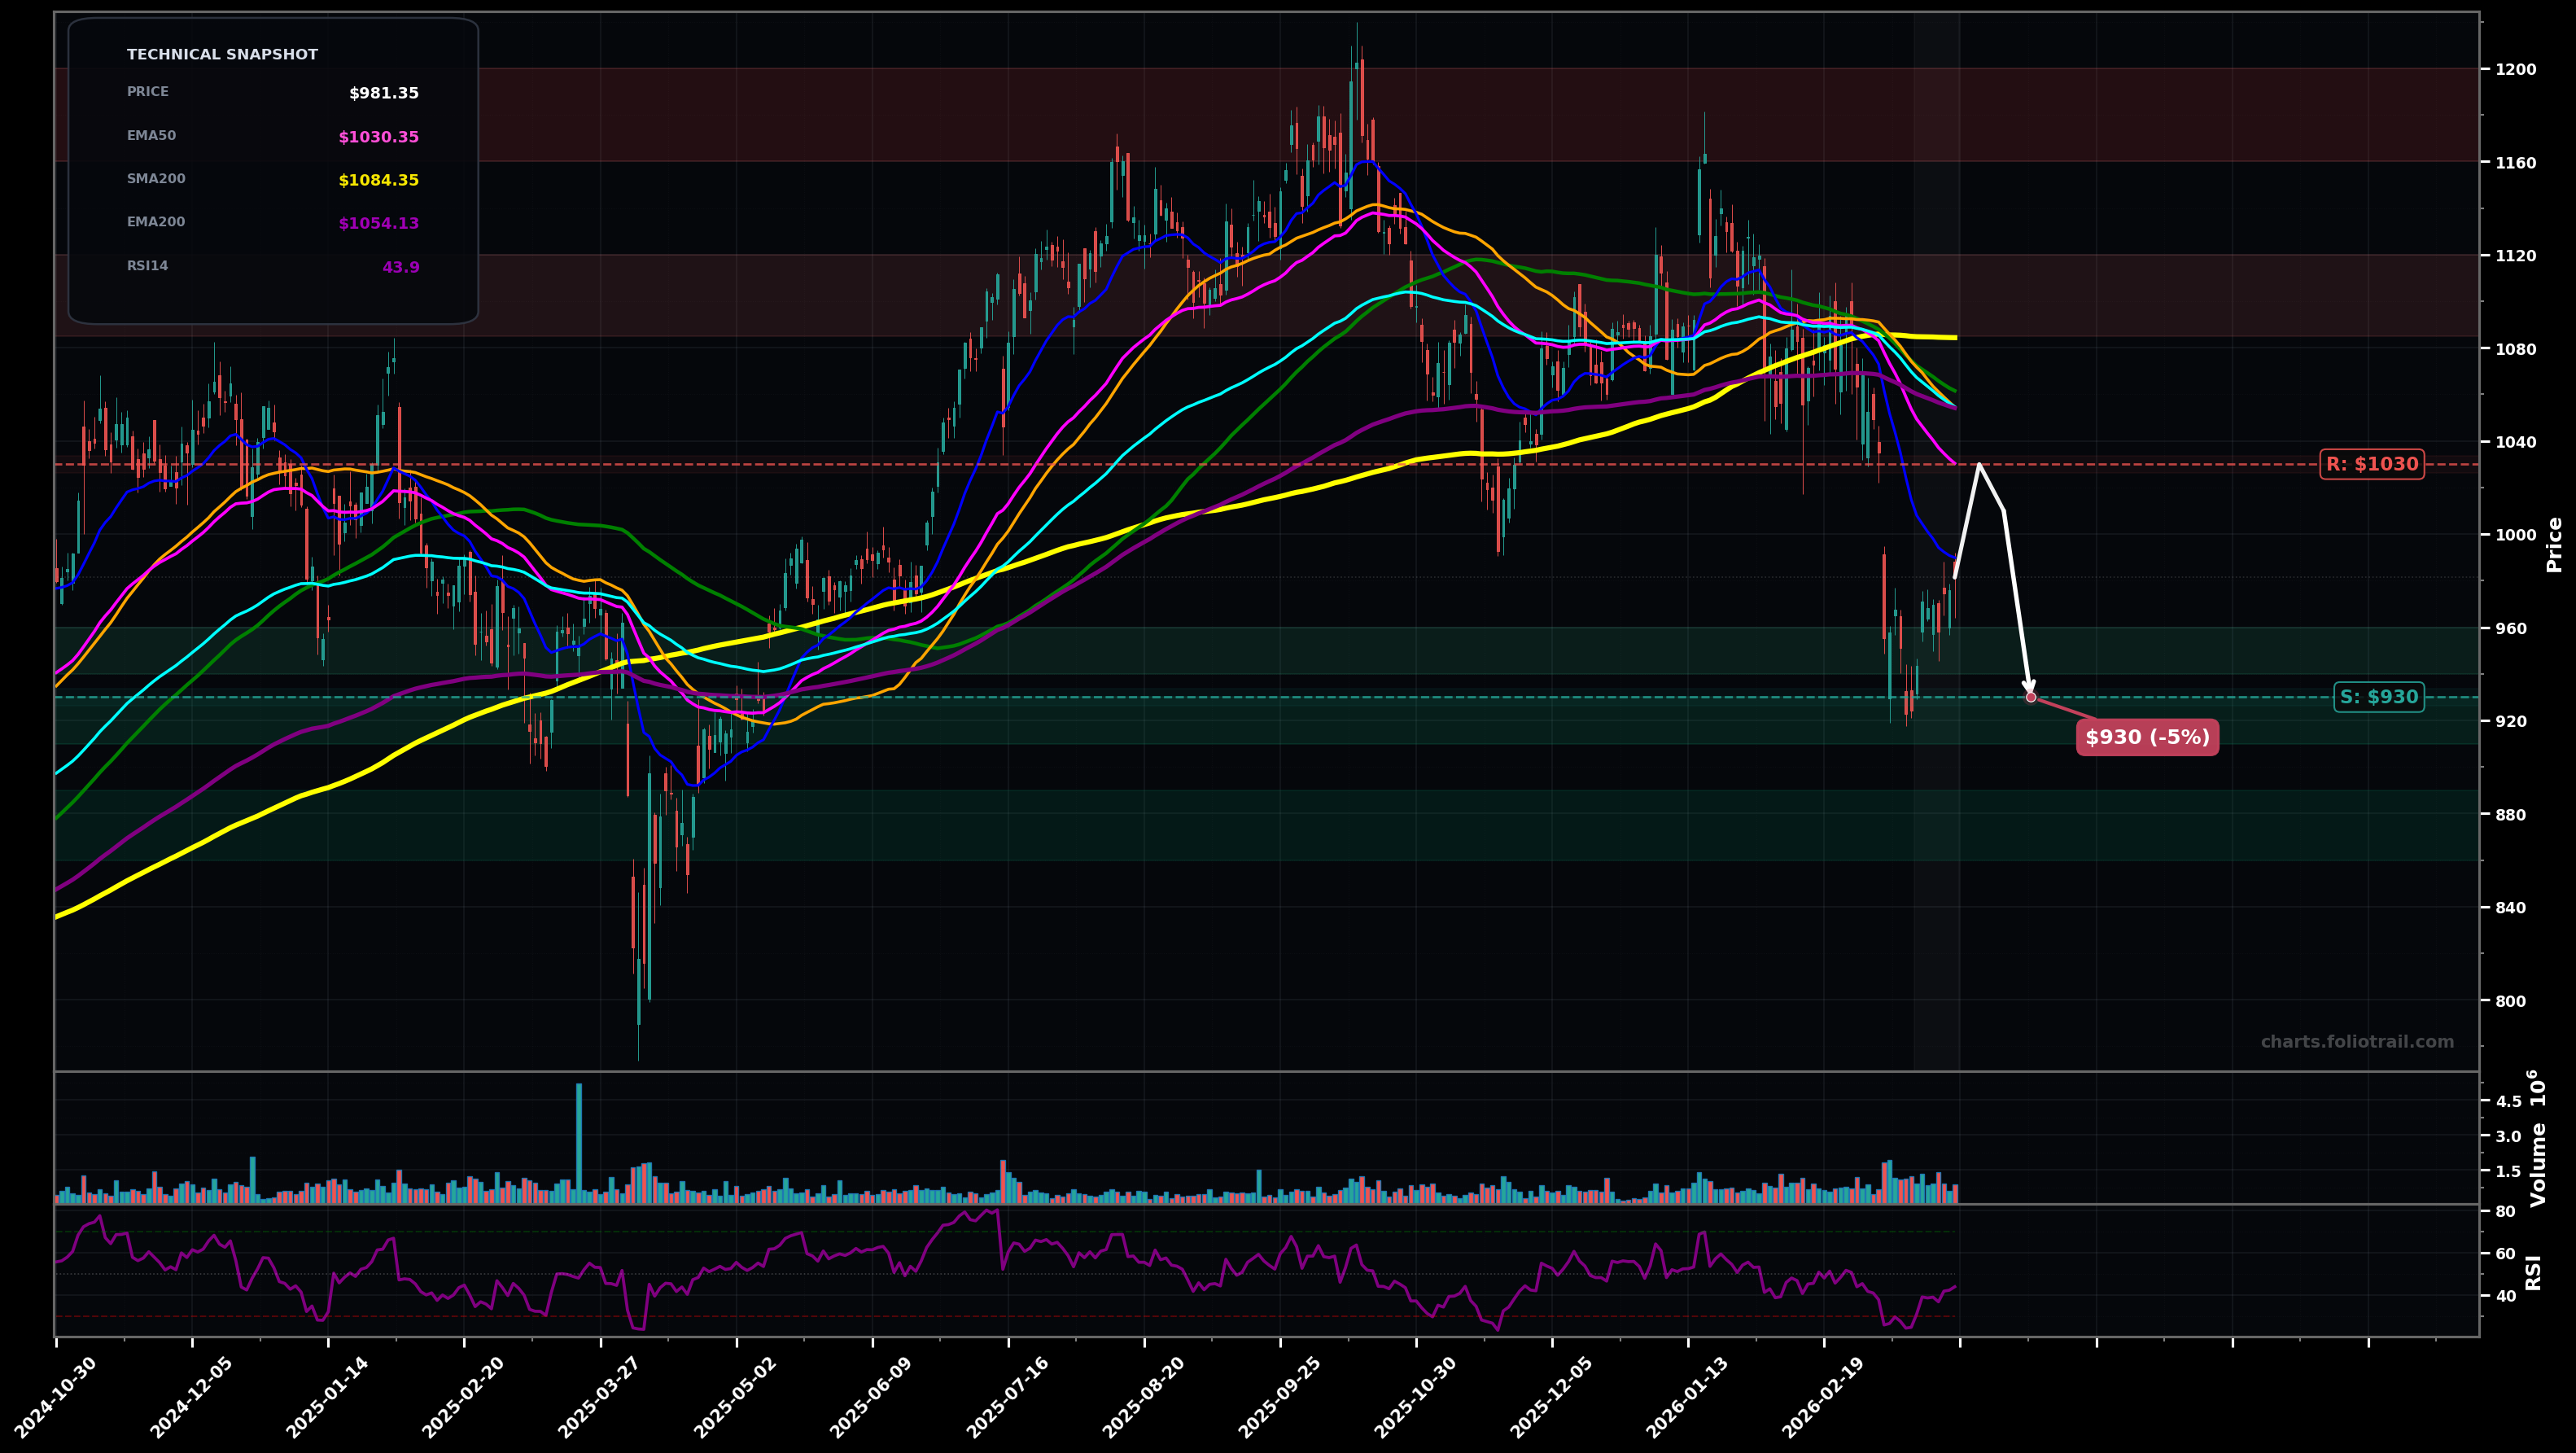
As of March 26, 2026, BLK (BlackRock, Inc.) is in a falling knife state on the daily chart, with a confidence level of 72%. Key support is at $930 and key resistance at $1030. Sharp breakdown from the $1,060–$1,080 MA cluster, flushed to ~$930s, now bouncing to ~$981 but still below key EMAs/SMAs (RSI~44).
Dead-cat bounce/corrective rally (Elliott: wave 4 / wave B) into the EMA50 then rejection; downside resumes to retest the flush lows and possibly slightly undercut.
Breakout-reversal attempt: price reclaims EMA50 then the $1,055–$1,065 confluence (EMA100 + MA cluster), turning the recent flush into an undercut-and-rally and starting a base.
Daily close below $960 followed by a break under $930 would confirm continuation risk.
Two daily closes back above $1,030 (EMA50) would invalidate the falling-knife characterization.
Buy zones keyed to prior swing-low shelf/flush area (~$930) and a deeper Fib-style extension risk if $930 fails; scale in only if volatility stabilizes.
Trim into overhead supply from the prior range highs and potential wave-5/extension zones; strongest trimming near prior peak/upper resistance band.
As of March 26, 2026, BLK (BlackRock, Inc.) is in a falling knife state on the daily chart with 72% confidence. Sharp breakdown from the $1,060–$1,080 MA cluster, flushed to ~$930s, now bouncing to ~$981 but still below key EMAs/SMAs (RSI~44).
On the daily timeframe, BLK has key support at $930 and key resistance at $1030. The most likely scenario (bearish) targets $1030 and $930, with a revert level at $1010.
BLK (BlackRock, Inc.) is currently classified as falling knife on the daily chart, with 72% confidence. Confirmation requires: Daily close below $960 followed by a break under $930 would confirm continuation risk. This would be invalidated by: Two daily closes back above $1,030 (EMA50) would invalidate the falling-knife characterization.
The most likely scenario (bearish) targets $1030 and $930, with a revert level at $1010. The alternative scenario (bullish) targets $1055 and $1085.
Multi-layer AI agents analyse 200+ stocks across daily, weekly, and monthly timeframes — producing market state classifications, price scenarios with targets, and position entry/exit levels. Updated every trading day after market close. No paywall. No sign-up required.
Built by Foliotrail.
All content on this website — including charts, analysis, price targets, support/resistance levels, and position zones — is generated entirely by AI and provided for educational and informational purposes only.
This is not financial advice. NEXUSNOIR VENTURES SL (the operator of this website) is not a registered investment adviser or broker-dealer. You should not make investment decisions based solely on this information. Always do your own research and consult a qualified financial advisor.
By continuing, you acknowledge that you have read and agree to our full disclaimer & terms of use and privacy policy.