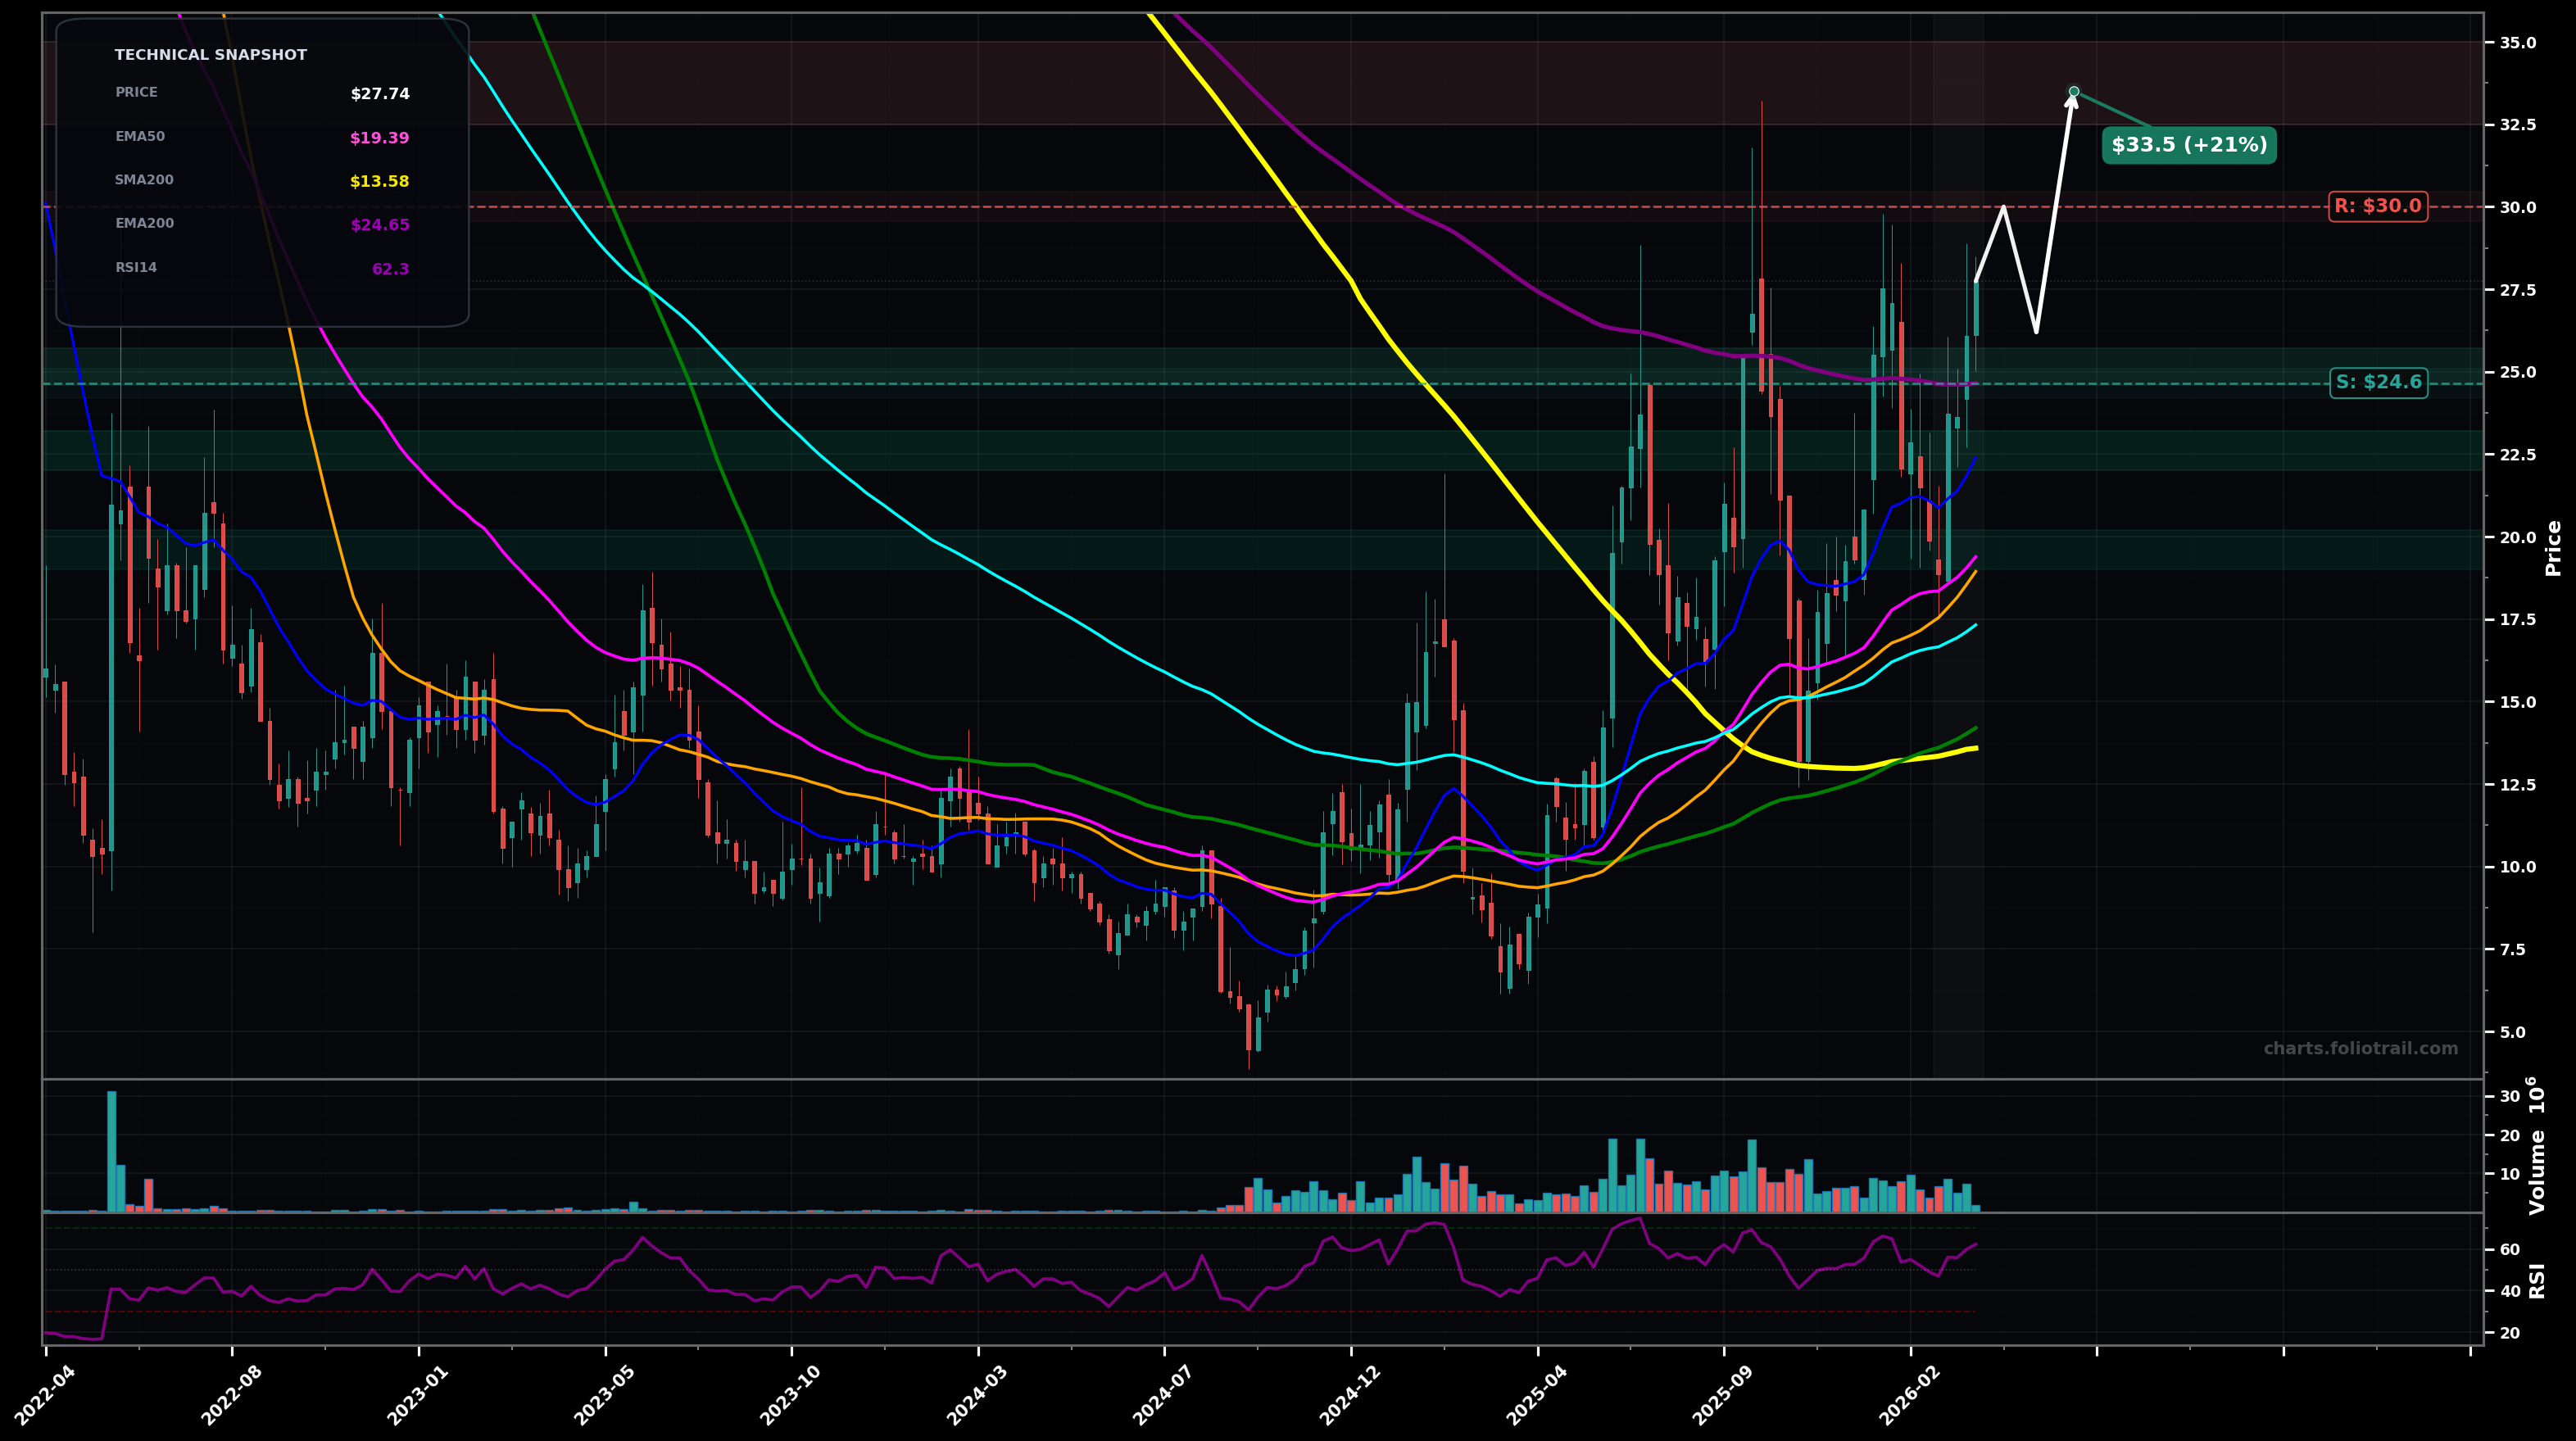
As of March 24, 2026, BKSY (BlackSky Technology Inc.) is in a volatility expansion state on the weekly chart, with a confidence level of 63%. Key support is at $24.6 and key resistance at $30.0. Price at ~$27.74 rejected below the long-term MA cluster; weekly swings show volatile HH/HL since mid-2024 but with a current stall under the $28-$30 supply zone while holding above rising EMA50/EMA100.
Bullish continuation: hold above the $24.5-$25 area (EMA200/pivot support) and grind higher; a break/hold above $30 triggers a measured push into the low-$30s as the next wave up extends.
Bearish pullback within the broader advance: failure to reclaim/hold $30 and a breakdown back under the $24.5-$25 pivot opens a deeper retrace toward the rising EMA50/EMA100 zone (typical Wave 4 / ABC reset before any new attempt higher).
Weekly close > $30.00 with a second follow-through close holding above $30.00
Weekly close < $22.40 (loss of EMA20/near-term swing support) shifts back toward a bearish corrective phase
Start near EMA200/pivot ($24.65) if it holds; add on a deeper pullback to prior breakout shelf ($22s); heavy add at EMA50 (~$19.4) / prior consolidation where risk-reward improves.
Trim into upside extensions after a confirmed $30 breakout (likely Wave 5/extension) as price gets increasingly stretched vs EMA50/EMA100; close into extreme multi-year extension bands if a blow-off advance prints.
As of March 24, 2026, BKSY (BlackSky Technology Inc.) is in a volatility expansion state on the weekly chart with 63% confidence. Price at ~$27.74 rejected below the long-term MA cluster; weekly swings show volatile HH/HL since mid-2024 but with a current stall under the $28-$30 supply zone while holding above rising EMA50/EMA100.
On the weekly timeframe, BKSY has key support at $24.6 and key resistance at $30.0. The most likely scenario (bullish) targets $30.0 and $33.5, with a revert level at $26.2.
BKSY (BlackSky Technology Inc.) is currently classified as volatility expansion on the weekly chart, with 63% confidence. Confirmation requires: Weekly close > $30.00 with a second follow-through close holding above $30.00 This would be invalidated by: Weekly close < $22.40 (loss of EMA20/near-term swing support) shifts back toward a bearish corrective phase
The most likely scenario (bullish) targets $30.0 and $33.5, with a revert level at $26.2. The alternative scenario (bearish) targets $22.4 and $19.4.
All content on this website — including charts, analysis, price targets, support/resistance levels, and position zones — is generated entirely by AI and provided for educational and informational purposes only.
This is not financial advice. NEXUSNOIR VENTURES SL (the operator of this website) is not a registered investment adviser or broker-dealer. You should not make investment decisions based solely on this information. Always do your own research and consult a qualified financial advisor.
By continuing, you acknowledge that you have read and agree to our full disclaimer & terms of use and privacy policy.