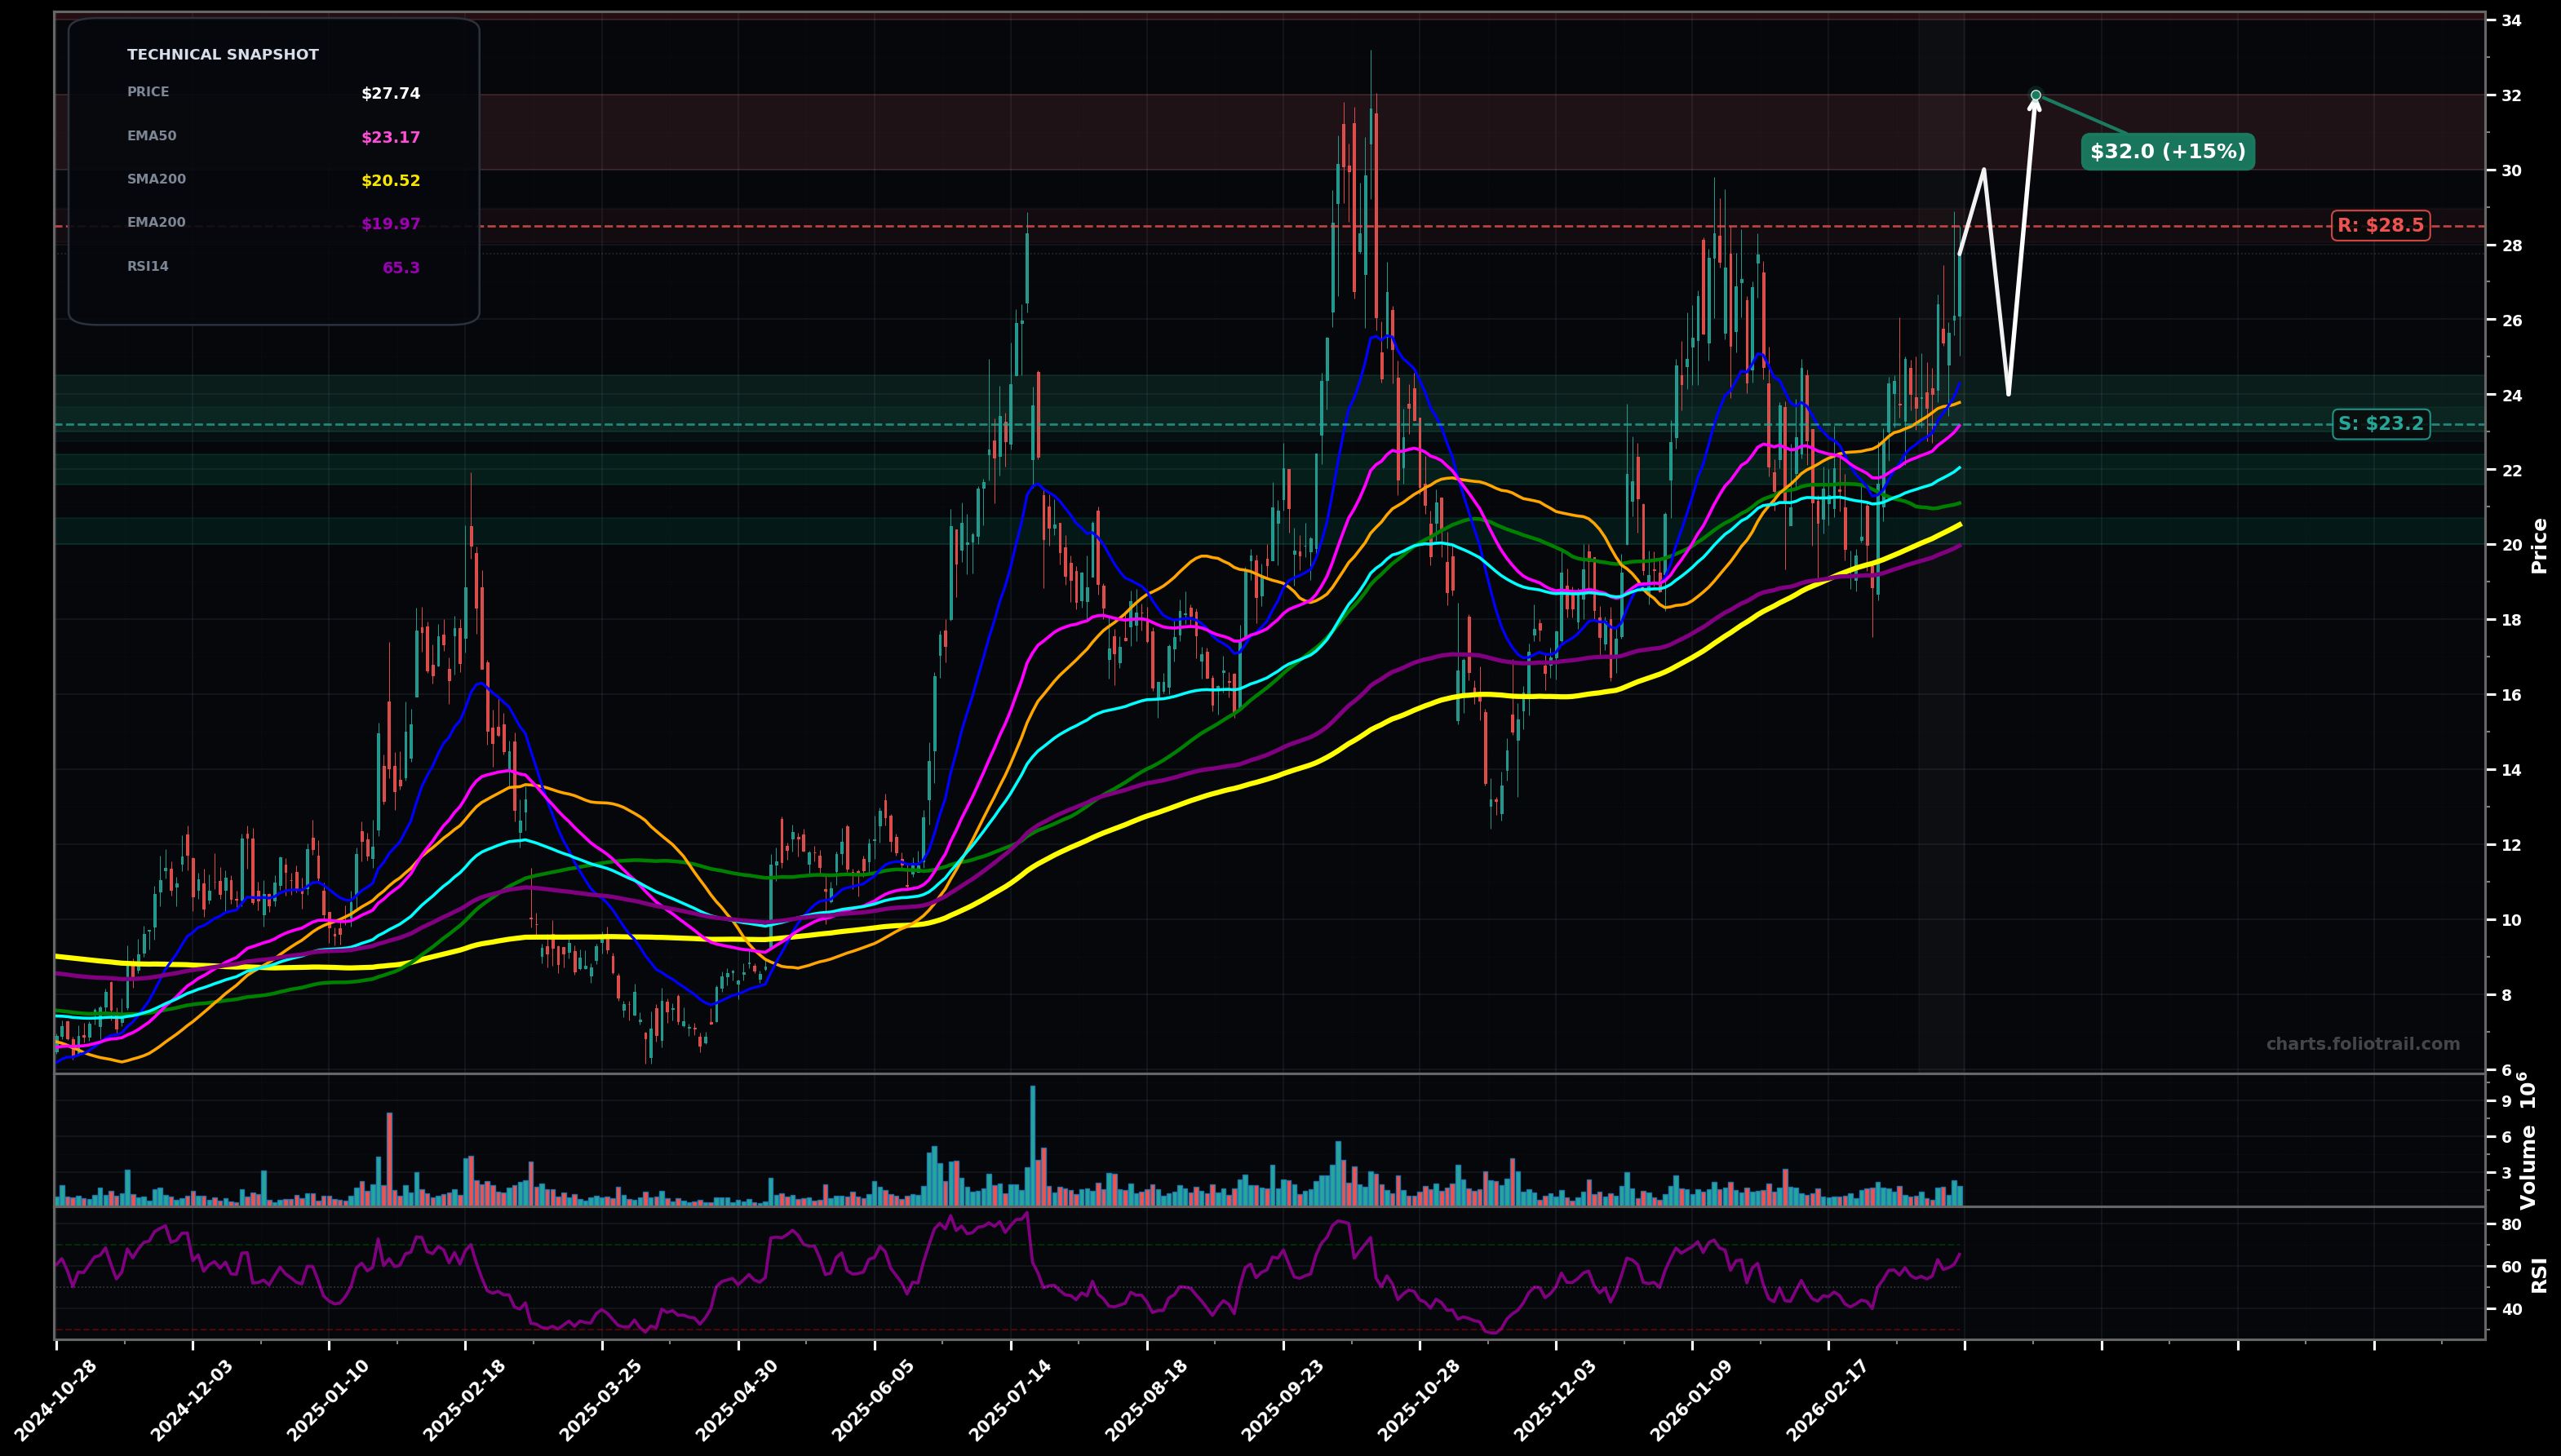
As of March 24, 2026, BKSY (BlackSky Technology Inc.) is in a uptrend state on the daily chart, with a confidence level of 68%. Key support is at $23.2 and key resistance at $28.5. Price at $27.74 pushed back above the rising EMA50 ($23.17) and is extending from the $22-$24 consolidation; momentum firm (RSI14 ~65).
Bullish continuation: pullback/retest holds above EMA50/SMA50 zone, then breakout through $28.50 and grind toward the prior swing-high supply band.
Bearish pullback: rejection near $28-$29 leads to a deeper mean-reversion into the EMA100/SMA100 area; if that fails, price revisits the long-term trend line/SMA200 region.
2+ daily closes above $28.50 would confirm trend continuation toward prior supply near $30-$32.
Daily close back below $22.00 would invalidate the current uptrend read and shift to range/breakdown risk.
Start near EMA50/SMA50 retest; add at EMA100/SMA100 confluence; heavy add near SMA200/EMA200 trend support if reached.
Trim into prior swing-high supply ($30-$32); heavier trims if price becomes extended well above rising MAs (Fib/extension behavior); close if a multi-year parabolic extension develops.
As of March 24, 2026, BKSY (BlackSky Technology Inc.) is in a uptrend state on the daily chart with 68% confidence. Price at $27.74 pushed back above the rising EMA50 ($23.17) and is extending from the $22-$24 consolidation; momentum firm (RSI14 ~65).
On the daily timeframe, BKSY has key support at $23.2 and key resistance at $28.5. The most likely scenario (bullish) targets $30.0 and $32.0, with a revert level at $24.0.
BKSY (BlackSky Technology Inc.) is currently classified as uptrend on the daily chart, with 68% confidence. Confirmation requires: 2+ daily closes above $28.50 would confirm trend continuation toward prior supply near $30-$32. This would be invalidated by: Daily close back below $22.00 would invalidate the current uptrend read and shift to range/breakdown risk.
The most likely scenario (bullish) targets $30.0 and $32.0, with a revert level at $24.0. The alternative scenario (bearish) targets $22.0 and $20.5.
All content on this website — including charts, analysis, price targets, support/resistance levels, and position zones — is generated entirely by AI and provided for educational and informational purposes only.
This is not financial advice. NEXUSNOIR VENTURES SL (the operator of this website) is not a registered investment adviser or broker-dealer. You should not make investment decisions based solely on this information. Always do your own research and consult a qualified financial advisor.
By continuing, you acknowledge that you have read and agree to our full disclaimer & terms of use and privacy policy.