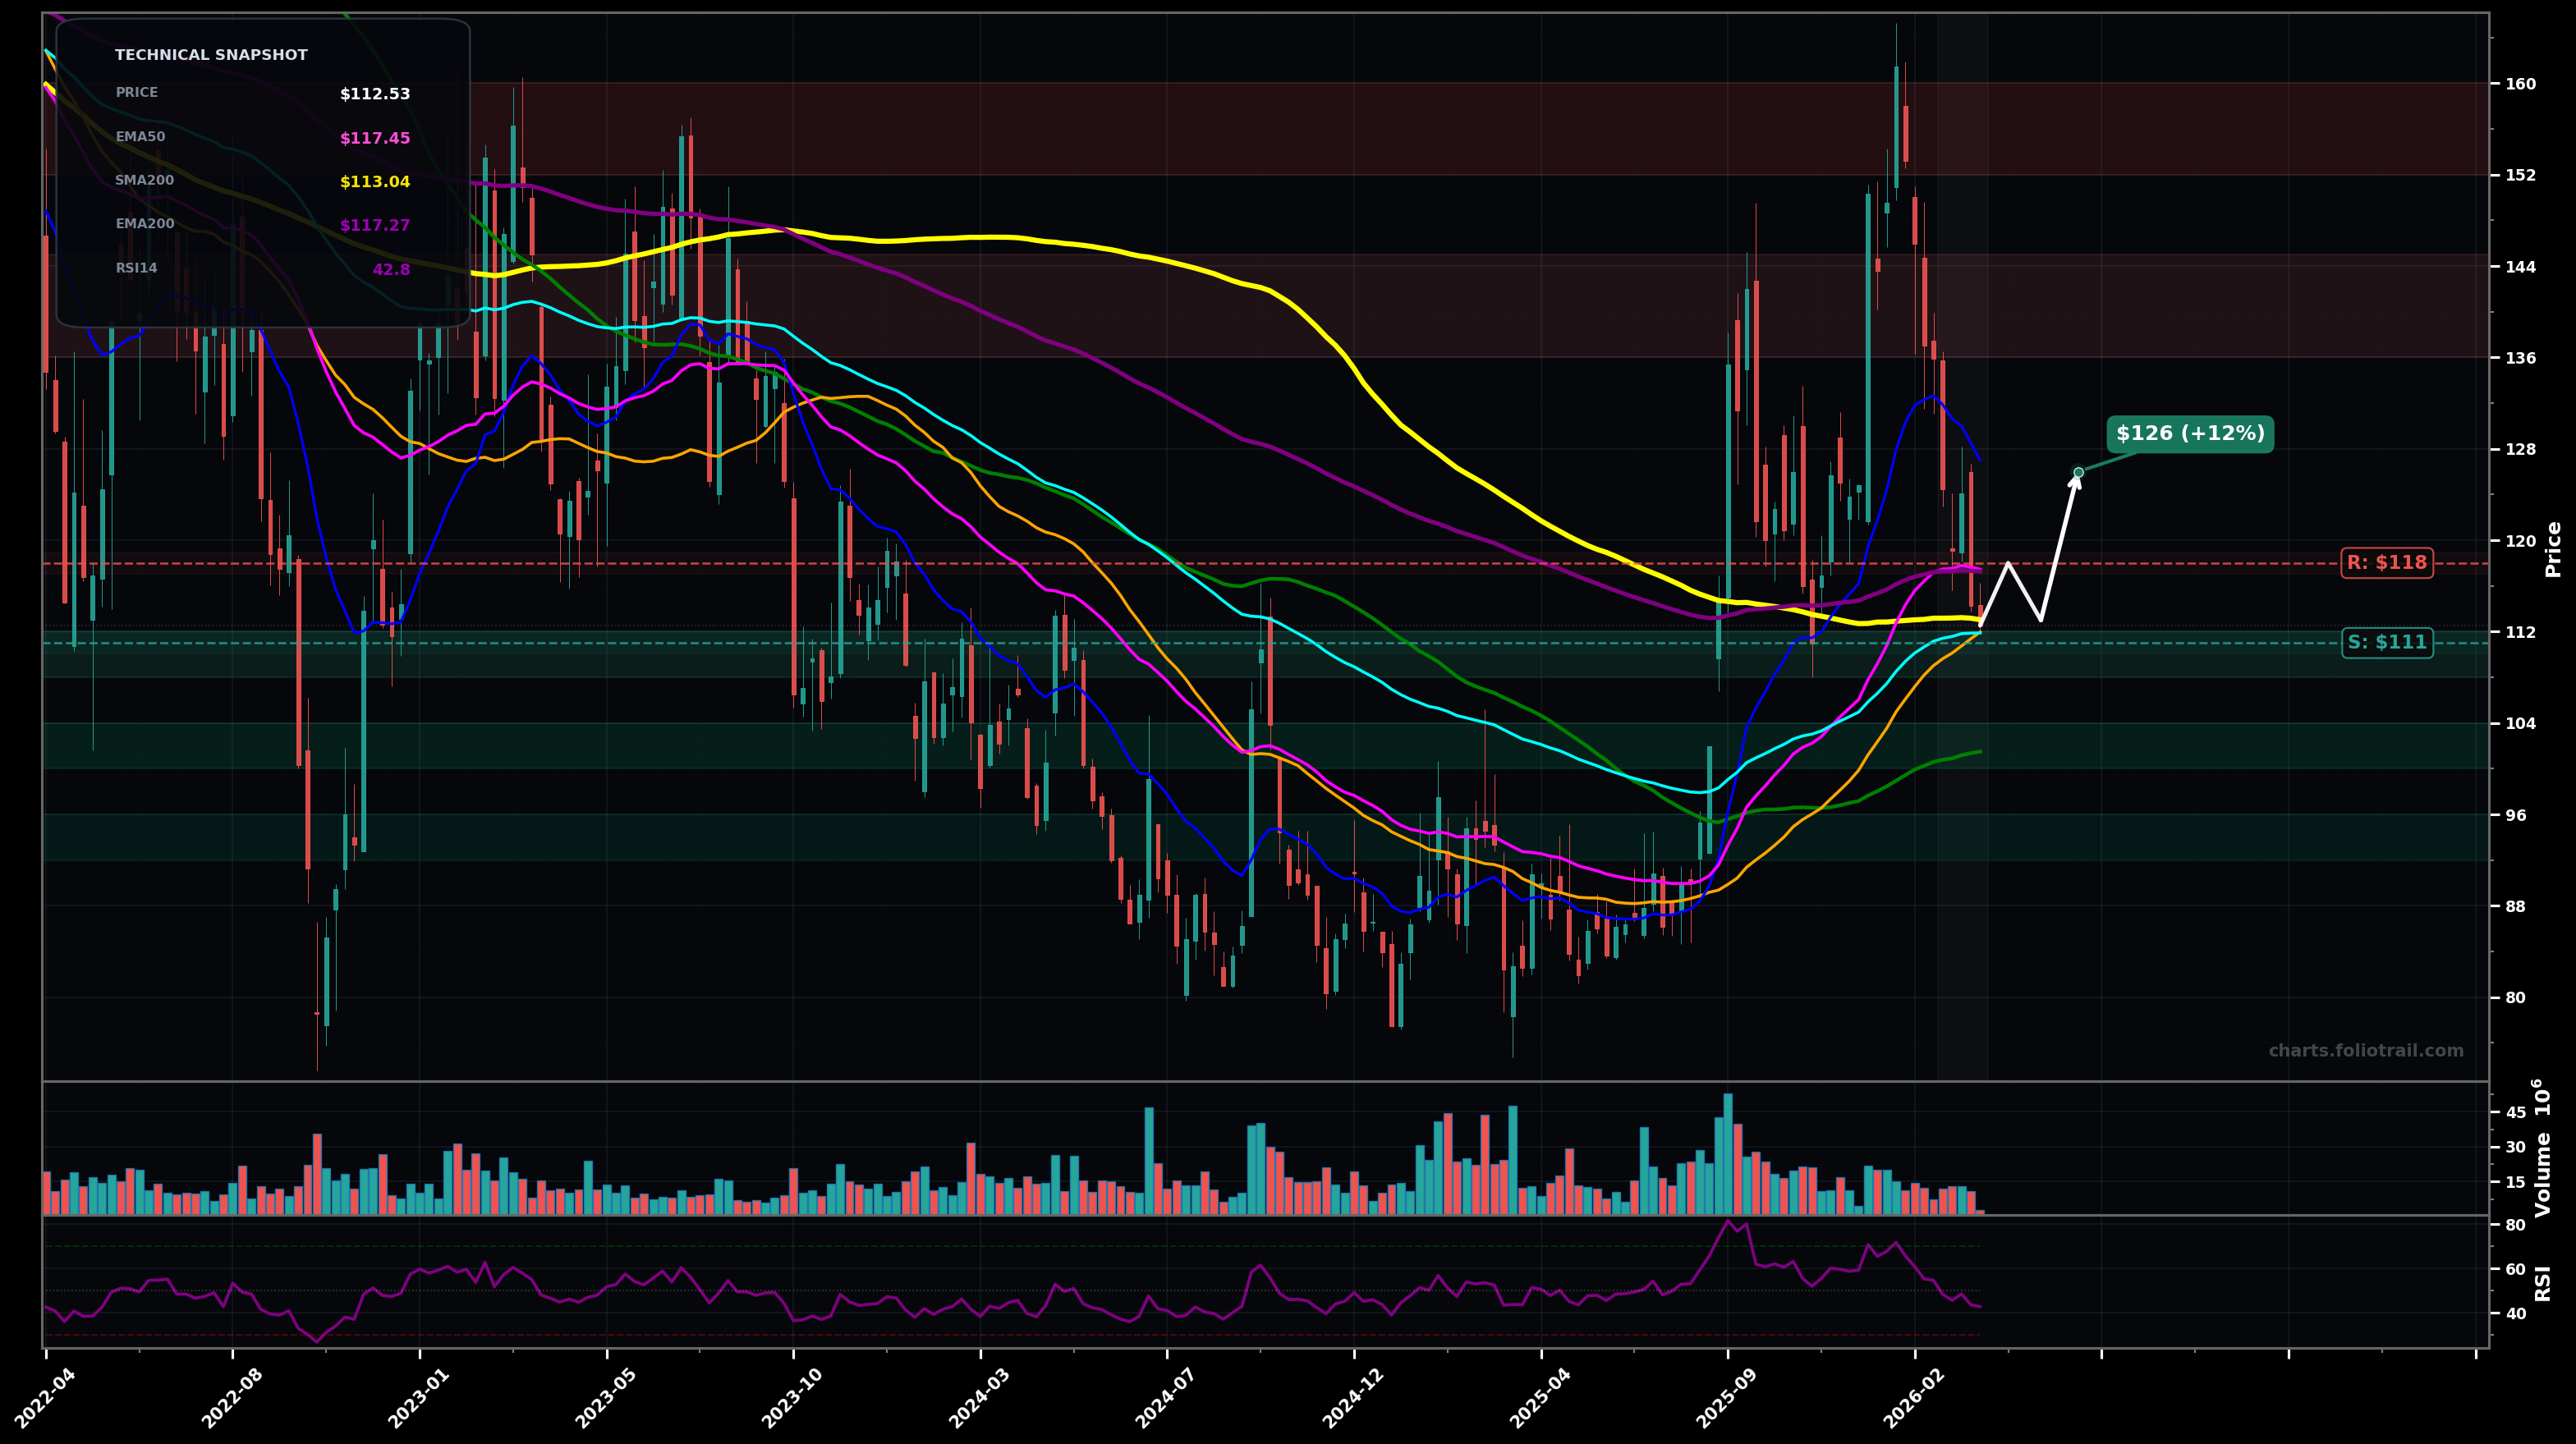
As of March 25, 2026, BIDU (Baidu Inc.) is in a downtrend state on the weekly chart, with a confidence level of 67%. Key support is at $111 and key resistance at $118. Weekly pullback from the $160 spike back into the clustered MAs; price ~$112.53 sitting just under the flat-ish SMA200 (~$113) and below falling EMA50/EMA100/EMA200; RSI ~42 (weak momentum).
Base-build attempt: price holds the $111–$112 area (SMA200/EMA100 cluster) and grinds back up to retest the $118–$120 supply; if accepted, mean-reversion toward $126.
Breakdown: loss of the $111 pivot triggers a move toward the next demand shelf near $104; if selling accelerates, a deeper retrace into the prior base around $96.
Weekly close below $111 would confirm downside continuation from the post-spike distribution.
Weekly close above $118 would invalidate the immediate downtrend pressure by reclaiming EMA50/nearby supply.
Staggered bids around the MA-cluster support ($111) first, then next horizontal demand ($104), then deeper prior base/likely Fib retrace zone ($96) if breakdown occurs.
Trim into prior supply from the spike/rejection zone ($136–$160); exit more aggressively if price becomes extended beyond the prior swing high region (>$175) where mean-reversion risk rises.
As of March 25, 2026, BIDU (Baidu Inc.) is in a downtrend state on the weekly chart with 67% confidence. Weekly pullback from the $160 spike back into the clustered MAs; price ~$112.53 sitting just under the flat-ish SMA200 (~$113) and below falling EMA50/EMA100/EMA200; RSI ~42 (weak momentum).
On the weekly timeframe, BIDU has key support at $111 and key resistance at $118. The most likely scenario (bullish) targets $118 and $126, with a revert level at $113.
BIDU (Baidu Inc.) is currently classified as downtrend on the weekly chart, with 67% confidence. Confirmation requires: Weekly close below $111 would confirm downside continuation from the post-spike distribution. This would be invalidated by: Weekly close above $118 would invalidate the immediate downtrend pressure by reclaiming EMA50/nearby supply.
The most likely scenario (bullish) targets $118 and $126, with a revert level at $113. The alternative scenario (bearish) targets $104 and $96.0.
Multi-layer AI agents analyse 200+ stocks across daily, weekly, and monthly timeframes — producing market state classifications, price scenarios with targets, and position entry/exit levels. Updated every trading day after market close. No paywall. No sign-up required.
Built by Foliotrail.
All content on this website — including charts, analysis, price targets, support/resistance levels, and position zones — is generated entirely by AI and provided for educational and informational purposes only.
This is not financial advice. NEXUSNOIR VENTURES SL (the operator of this website) is not a registered investment adviser or broker-dealer. You should not make investment decisions based solely on this information. Always do your own research and consult a qualified financial advisor.
By continuing, you acknowledge that you have read and agree to our full disclaimer & terms of use and privacy policy.