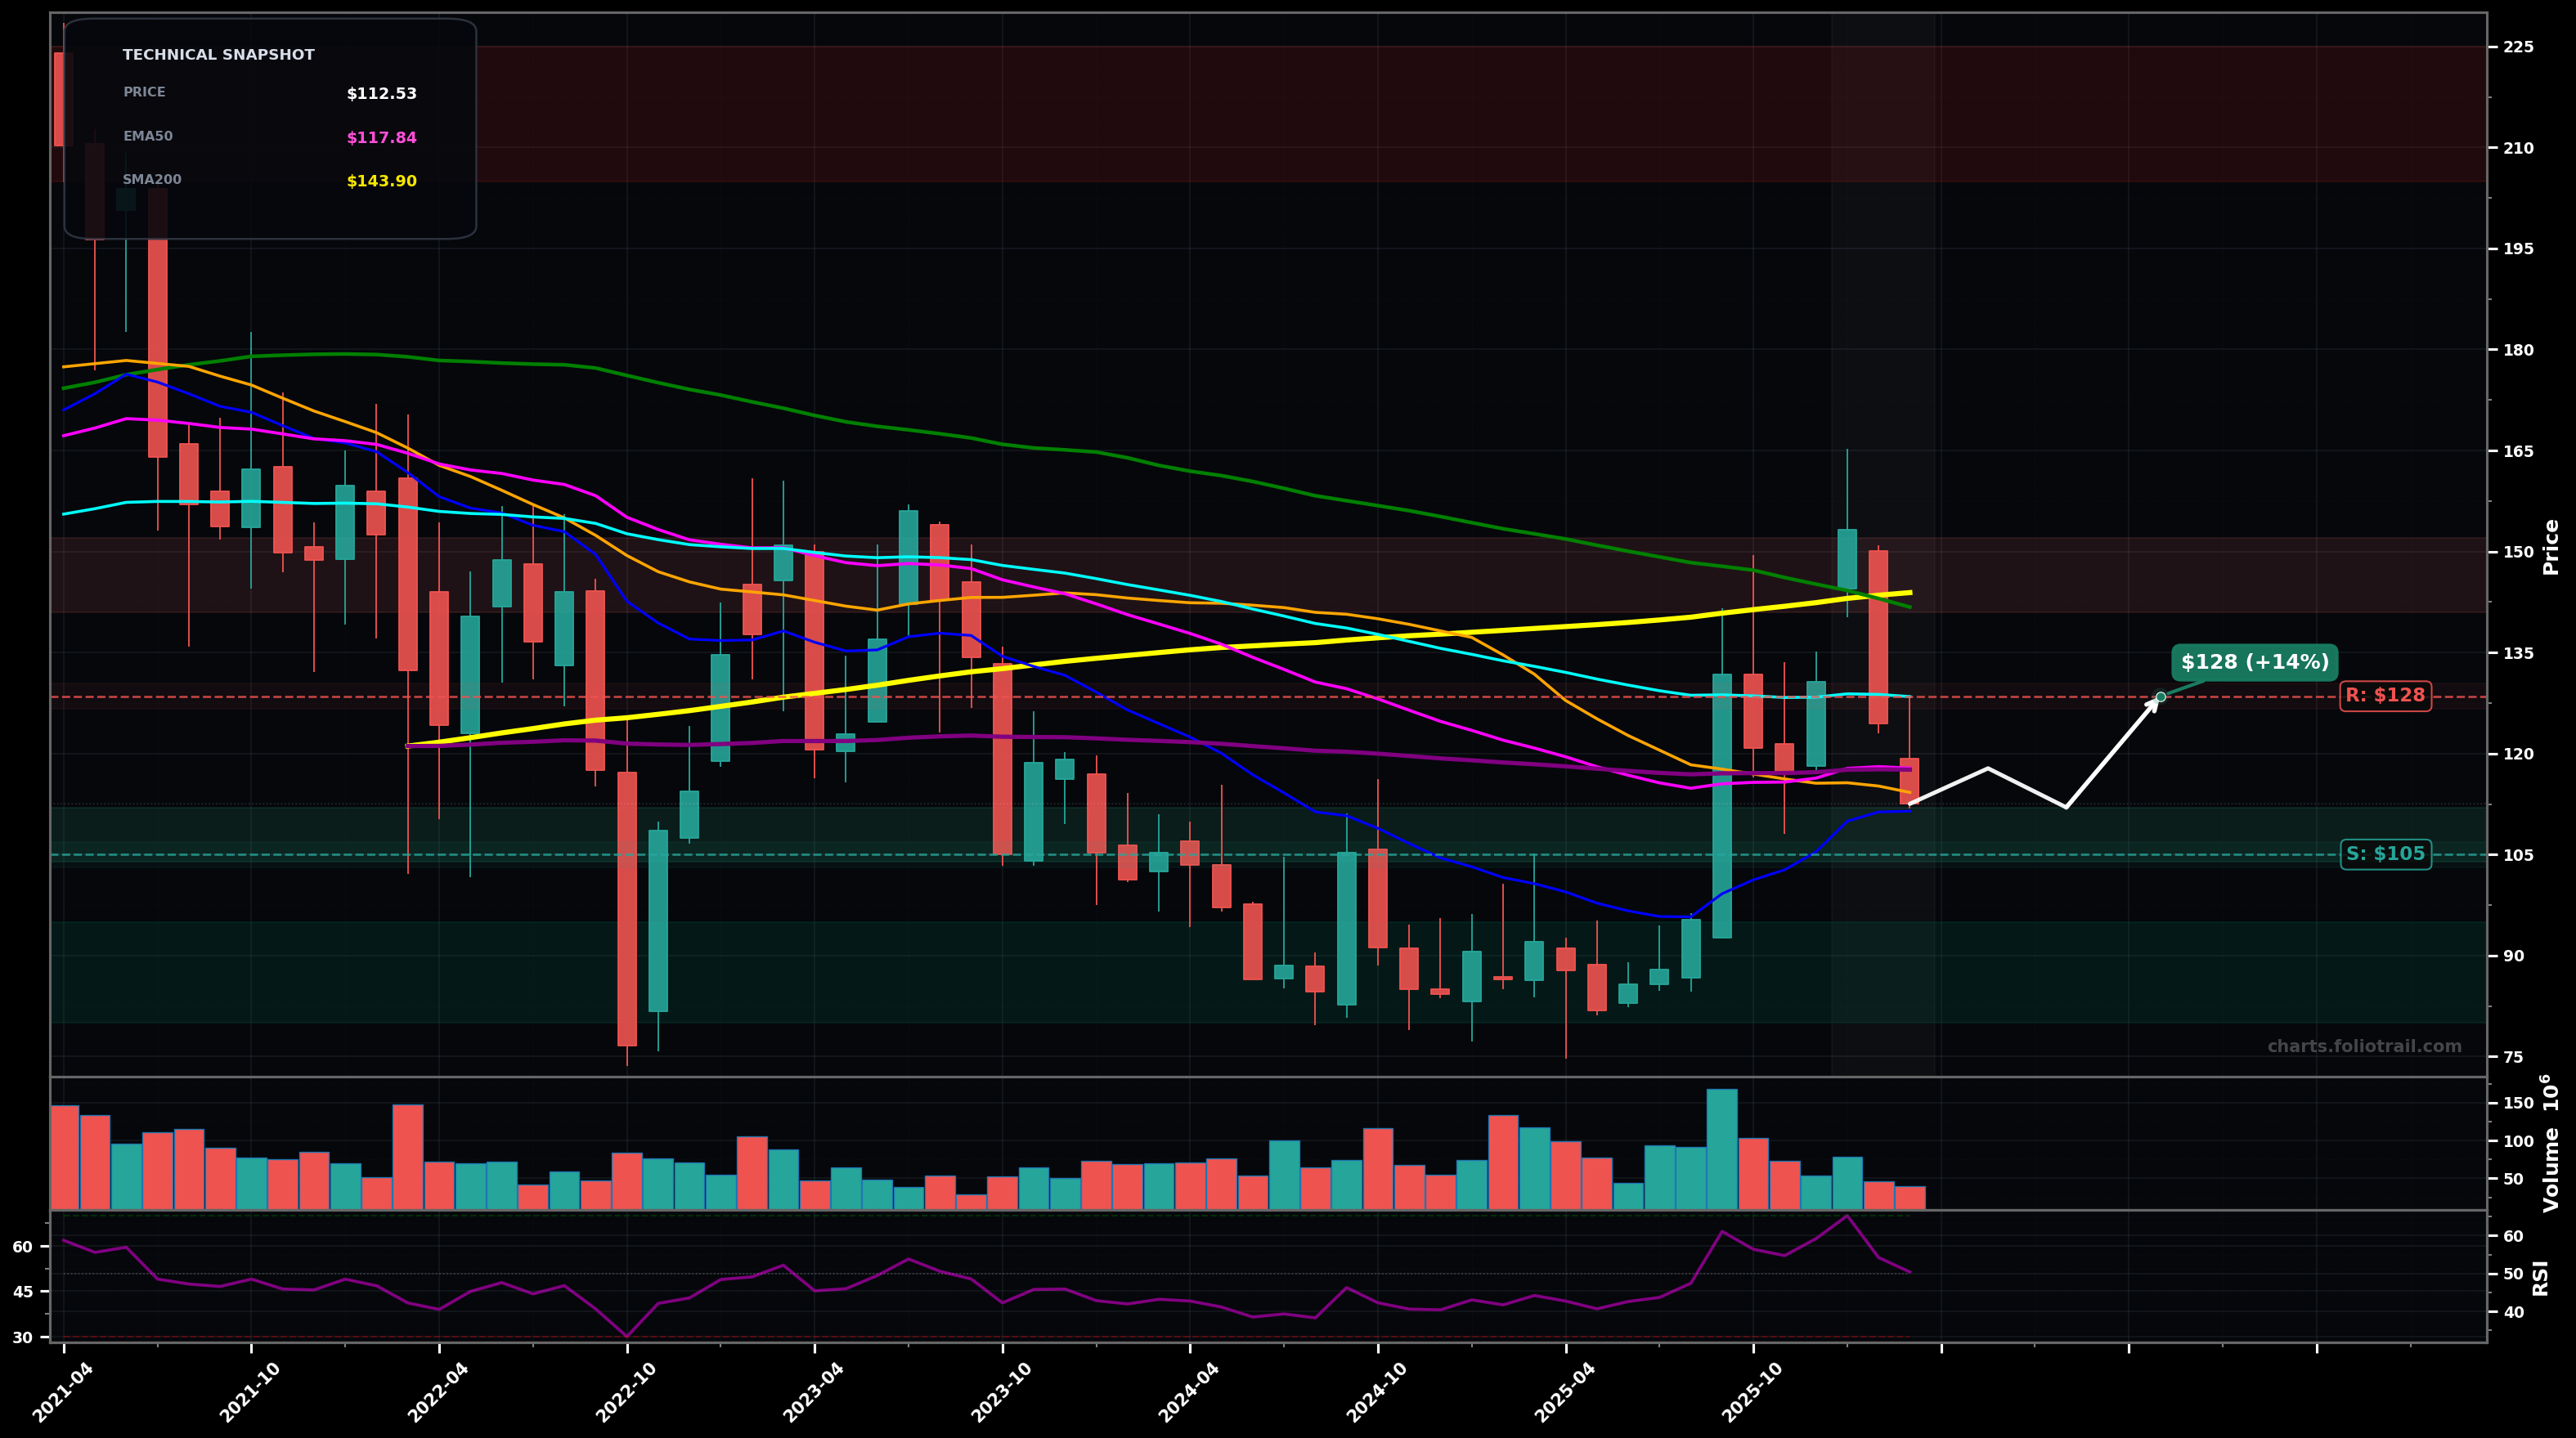
As of March 25, 2026, BIDU (Baidu Inc.) is in a downtrend state on the monthly chart, with a confidence level of 67%. Key support is at $105 and key resistance at $128. Monthly bounce failed at long-term MA cluster; last candles pulled back to ~$112.5, sitting below EMA50/EMA100 and under the ~$114 SMA50 pivot zone.
Base-building then rebound: holds ~$105 support, forms a higher low on monthly, and grinds back toward the MA cluster for a retest (mean-reversion within a broader downtrend).
Downtrend resumes: fails to hold ~$105, triggering a breakdown to prior demand zone; aligns with an Elliott wave-style continuation leg (likely wave 5 / C) after the rally into ~$150 rejected.
Monthly close below $105.00 (breaks the recent swing-low shelf) would confirm downtrend continuation
2+ monthly closes above $128.45 (EMA100) would invalidate the current downtrend bias
Start near the swing-low reference/support shelf (~$105) with tight invalidation; add on breakdown/flush into prior base demand (~$95) and heavy add into capitulation/major support (~$80) while price is below EMA50/EMA100.
Trim into overhead supply where prior rallies rejected and where price would be extended vs long MAs (SMA200 ~$143.9, SMA100 ~$141.8); heavier trims if a multi-year re-rating pushes well above the long-term mean.
As of March 25, 2026, BIDU (Baidu Inc.) is in a downtrend state on the monthly chart with 67% confidence. Monthly bounce failed at long-term MA cluster; last candles pulled back to ~$112.5, sitting below EMA50/EMA100 and under the ~$114 SMA50 pivot zone.
On the monthly timeframe, BIDU has key support at $105 and key resistance at $128. The most likely scenario (bullish) targets $118 and $128, with a revert level at $112.
BIDU (Baidu Inc.) is currently classified as downtrend on the monthly chart, with 67% confidence. Confirmation requires: Monthly close below $105.00 (breaks the recent swing-low shelf) would confirm downtrend continuation This would be invalidated by: 2+ monthly closes above $128.45 (EMA100) would invalidate the current downtrend bias
The most likely scenario (bullish) targets $118 and $128, with a revert level at $112. The alternative scenario (bearish) targets $95.0 and $80.0.
Multi-layer AI agents analyse 200+ stocks across daily, weekly, and monthly timeframes — producing market state classifications, price scenarios with targets, and position entry/exit levels. Updated every trading day after market close. No paywall. No sign-up required.
Built by Foliotrail.
All content on this website — including charts, analysis, price targets, support/resistance levels, and position zones — is generated entirely by AI and provided for educational and informational purposes only.
This is not financial advice. NEXUSNOIR VENTURES SL (the operator of this website) is not a registered investment adviser or broker-dealer. You should not make investment decisions based solely on this information. Always do your own research and consult a qualified financial advisor.
By continuing, you acknowledge that you have read and agree to our full disclaimer & terms of use and privacy policy.