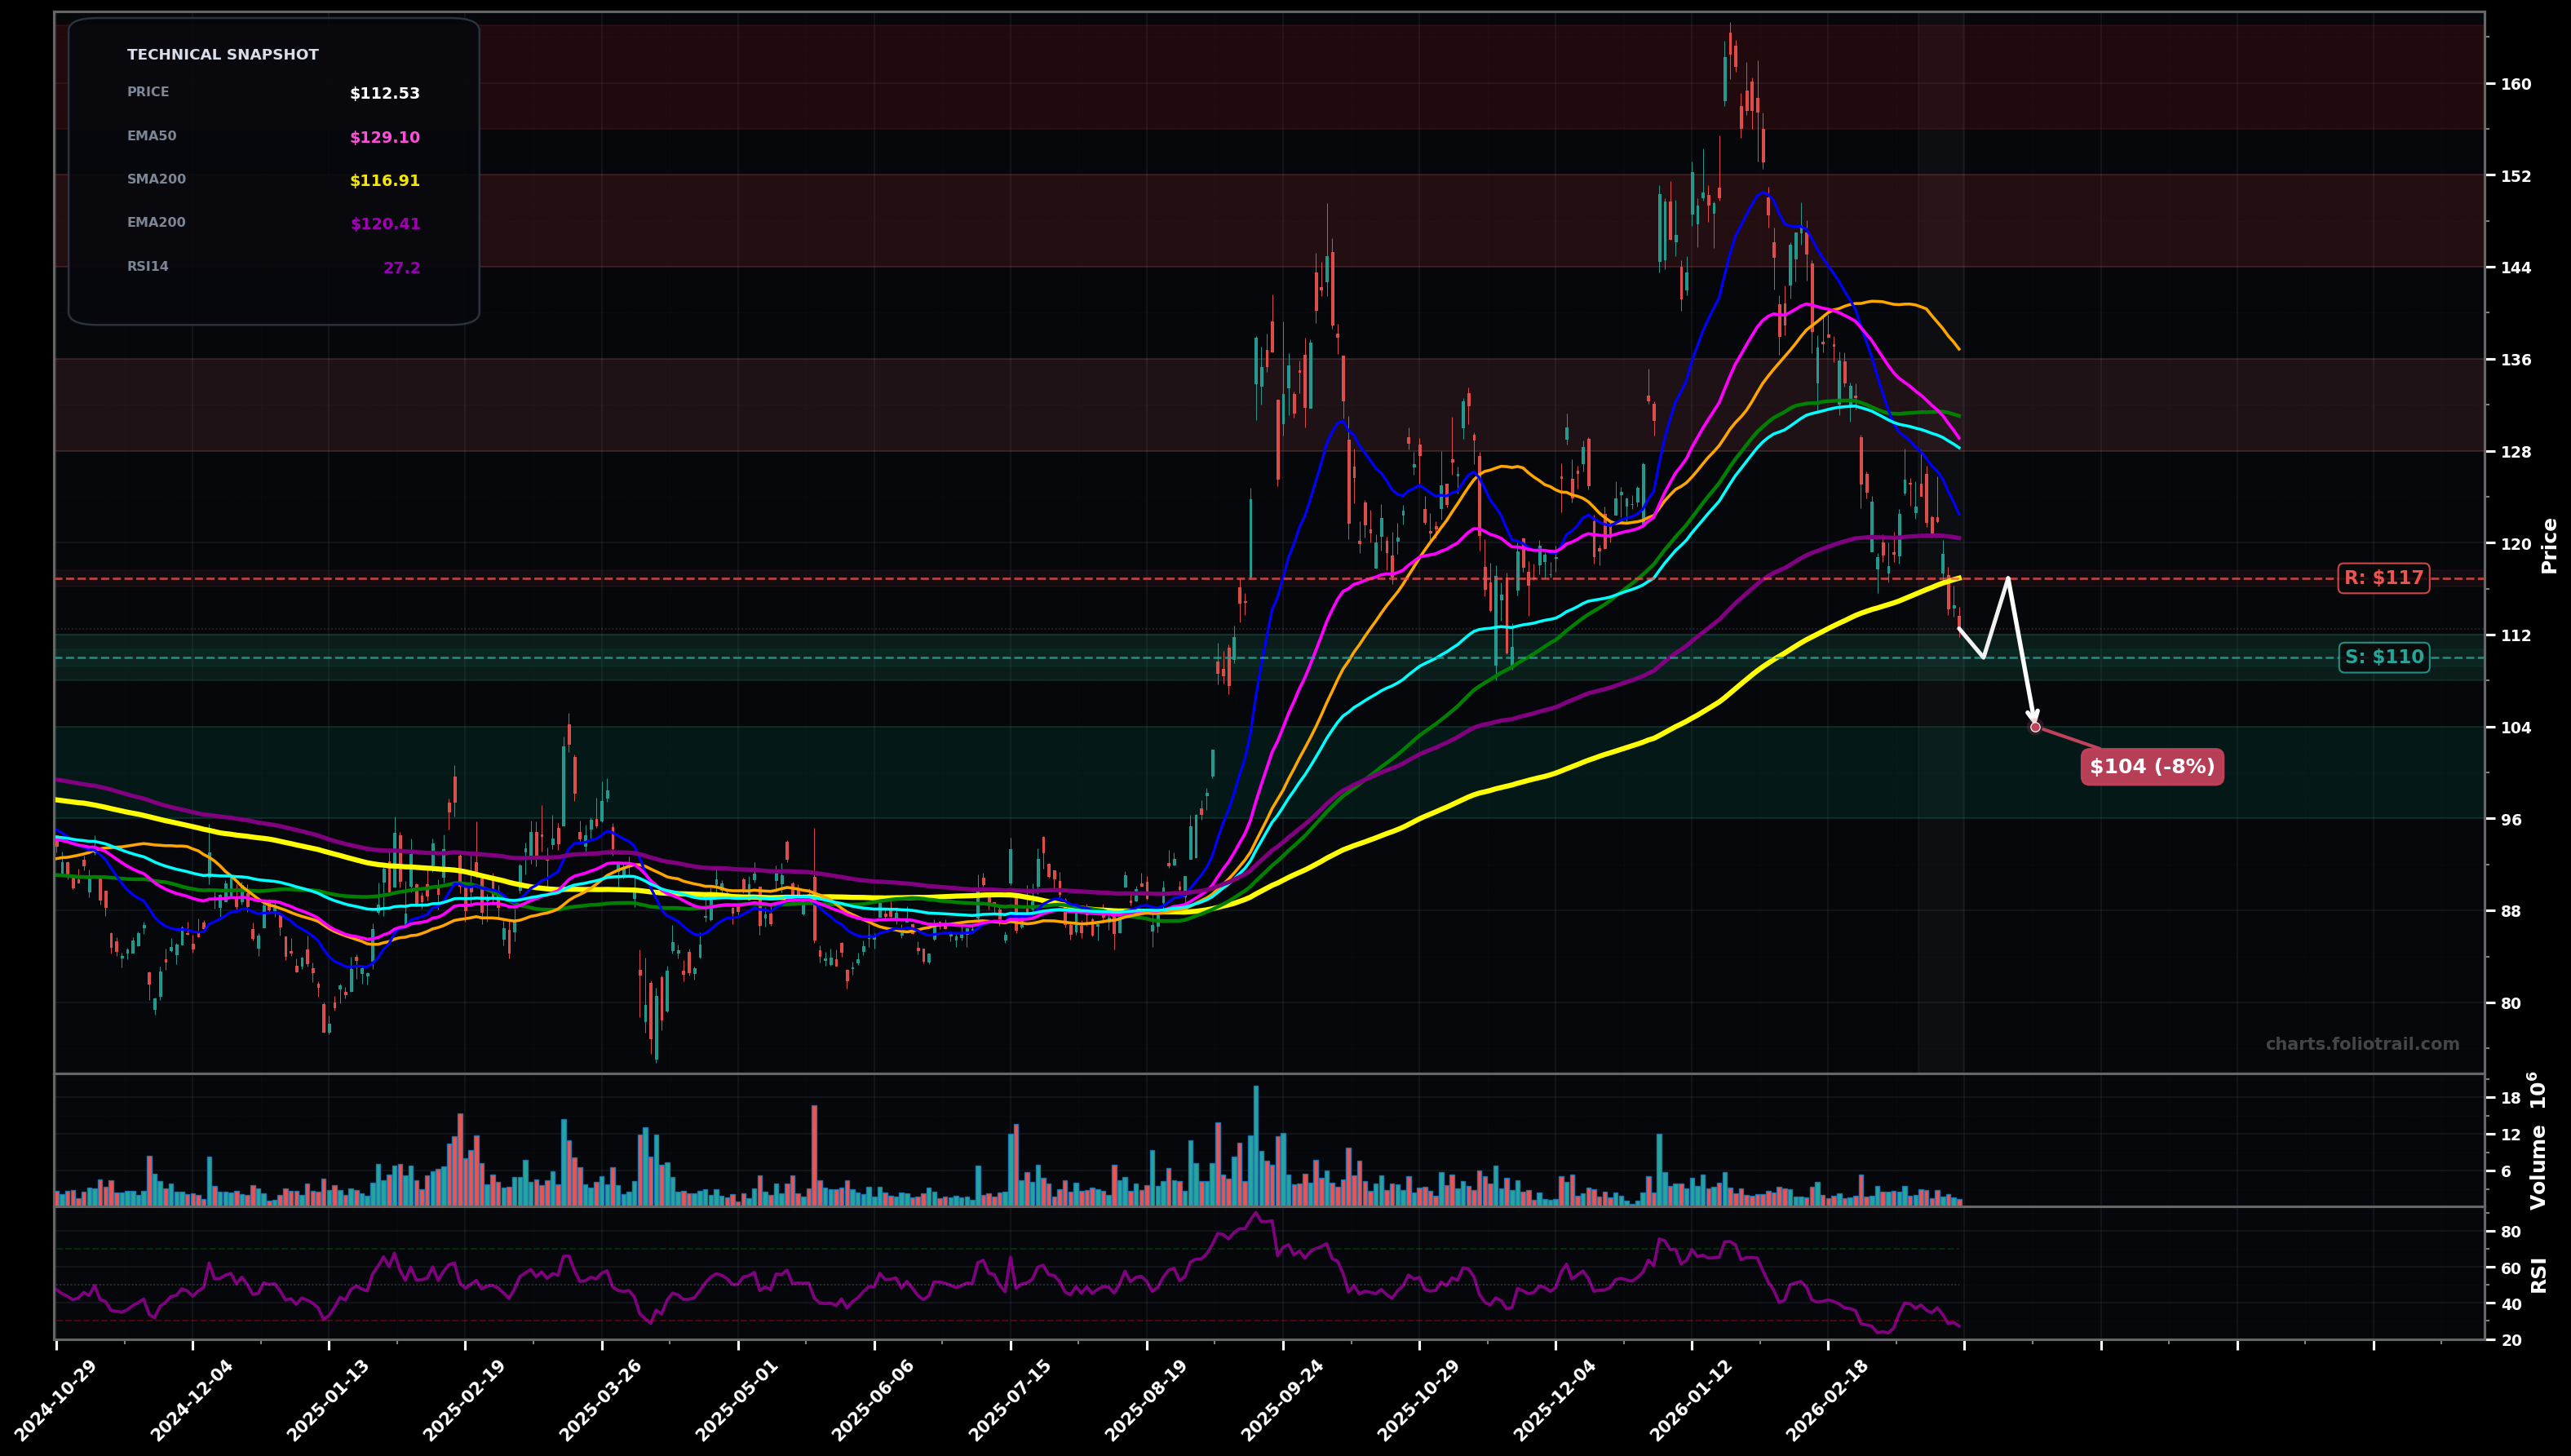
As of March 25, 2026, BIDU (Baidu Inc.) is in a falling knife state on the daily chart, with a confidence level of 66%. Key support is at $110 and key resistance at $117. Sharp selloff from the $150–$160 peak; price ($112.53) is below EMA50/EMA100 and sitting just under the rising SMA200 (~$116.91) with RSI ~27 (oversold).
Continuation lower into the next demand pocket as price stays below the SMA200/EMA200 cluster; oversold can bounce, but trend remains down until $120+ is reclaimed.
Oversold relief rally (likely Wave (B) / corrective bounce) back to the broken moving-average band, then decision point; if it can hold above $120 it can attempt a trend change.
Daily close below $110 would confirm continued FALLING_KNIFE behavior (next leg down).
Two consecutive daily closes back above $120 would invalidate the immediate knife behavior and shift toward a bottoming attempt.
Layered bids around round-number support ($110) and likely Fib retrace zone of the prior impulse; heavier adds only if capitulation pushes into the next lower base/pivot region.
Trim into the first meaningful MA-reclaim band (EMA50/SMA50 area) and scale out aggressively near prior distribution/swing-high supply ($150–$160) where the last major top formed.
As of March 25, 2026, BIDU (Baidu Inc.) is in a falling knife state on the daily chart with 66% confidence. Sharp selloff from the $150–$160 peak; price ($112.53) is below EMA50/EMA100 and sitting just under the rising SMA200 (~$116.91) with RSI ~27 (oversold).
On the daily timeframe, BIDU has key support at $110 and key resistance at $117. The most likely scenario (bearish) targets $110 and $104, with a revert level at $117.
BIDU (Baidu Inc.) is currently classified as falling knife on the daily chart, with 66% confidence. Confirmation requires: Daily close below $110 would confirm continued FALLING_KNIFE behavior (next leg down). This would be invalidated by: Two consecutive daily closes back above $120 would invalidate the immediate knife behavior and shift toward a bottoming attempt.
The most likely scenario (bearish) targets $110 and $104, with a revert level at $117. The alternative scenario (bullish) targets $120 and $128.
Multi-layer AI agents analyse 200+ stocks across daily, weekly, and monthly timeframes — producing market state classifications, price scenarios with targets, and position entry/exit levels. Updated every trading day after market close. No paywall. No sign-up required.
Built by Foliotrail.
All content on this website — including charts, analysis, price targets, support/resistance levels, and position zones — is generated entirely by AI and provided for educational and informational purposes only.
This is not financial advice. NEXUSNOIR VENTURES SL (the operator of this website) is not a registered investment adviser or broker-dealer. You should not make investment decisions based solely on this information. Always do your own research and consult a qualified financial advisor.
By continuing, you acknowledge that you have read and agree to our full disclaimer & terms of use and privacy policy.