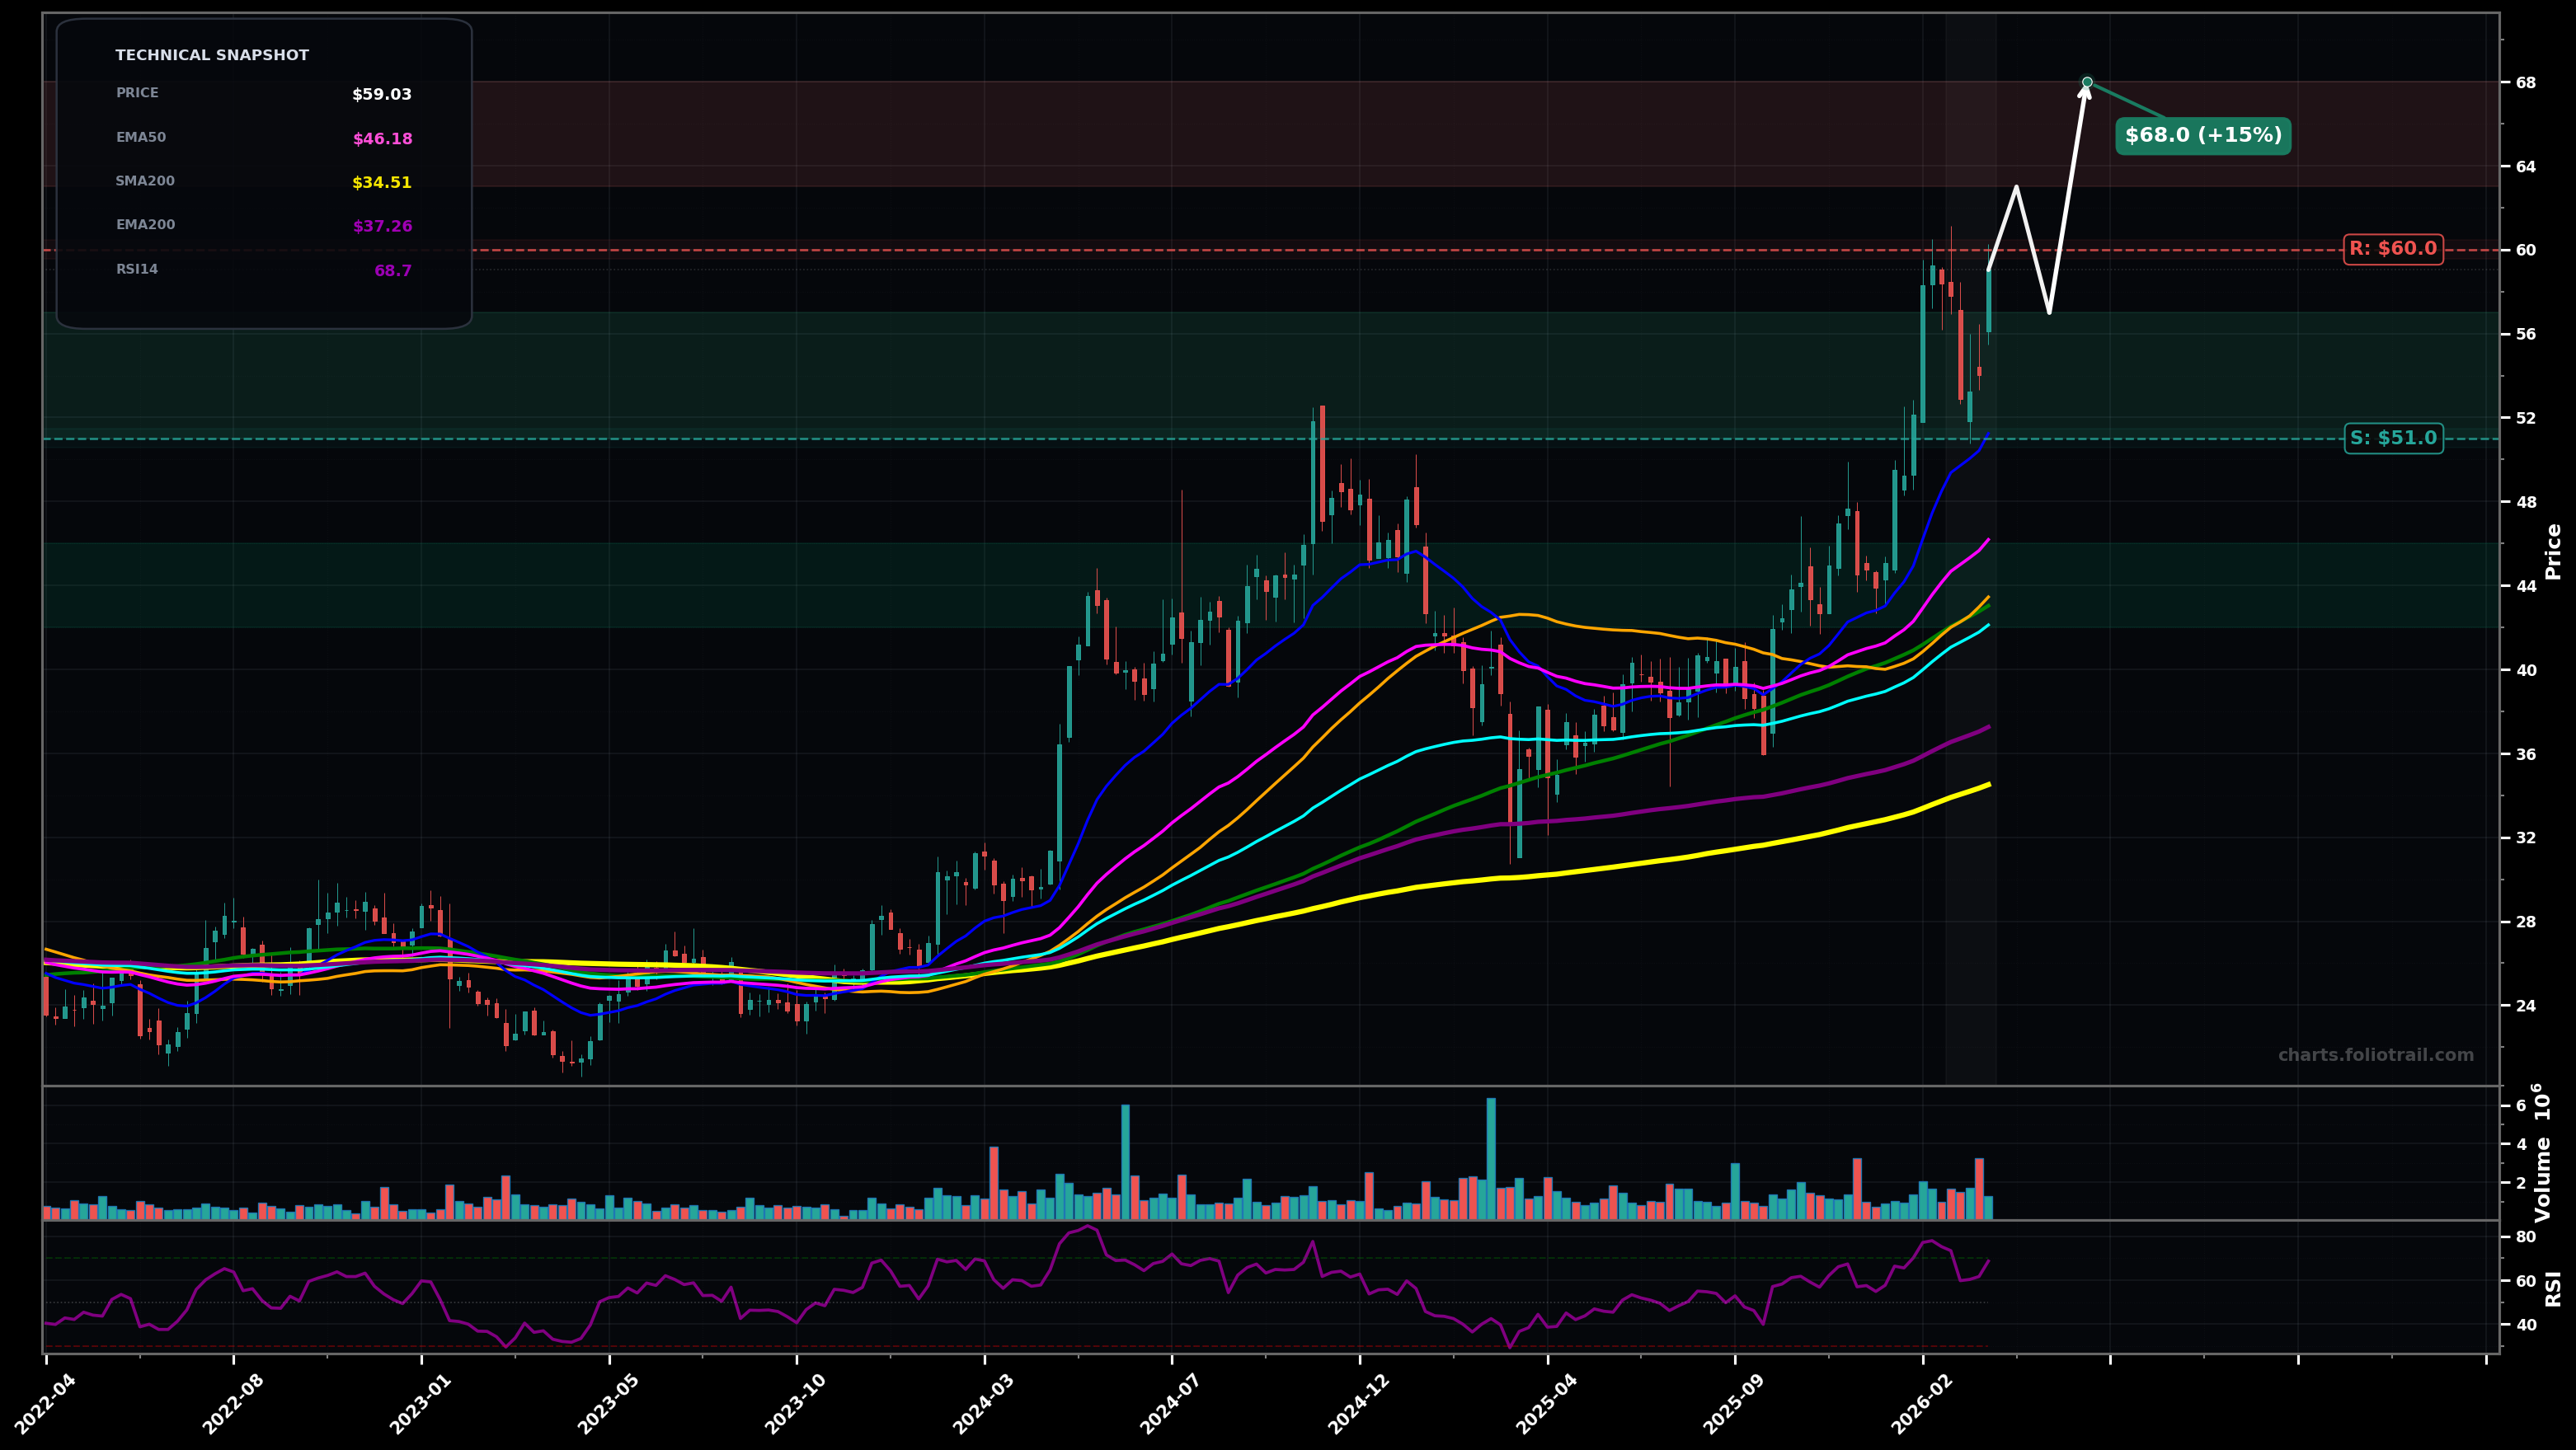
As of March 26, 2026, BHE (Benchmark Electronics Inc.) is in a uptrend state on the weekly chart, with a confidence level of 78%. Key support is at $51.0 and key resistance at $60.0. Strong weekly impulse to fresh highs near $60 after a breakout from the $42–$45 base; price extended above rising EMA50/EMA100 with RSI ~$69.
Bullish continuation: brief digestion/pullback that holds above $51–$57, then another push higher (Elliott: likely wave 5 extension after a wave-4 consolidation; Fibonacci: shallow 0.236–0.382 pullback zone aligns with $57–$51). ~65%.
Deeper mean-reversion: failure to hold $57 leads to a pullback toward the rising cluster around $46–$43 (EMA50/SMA50/SMA100 area), then attempt to re-base and resume trend (Elliott: wave-4 becomes more complex/sideways; Fibonacci: 0.5–0.618 retrace zone likely). ~35%.
Weekly close holding above $57 (prior breakout zone) for 2+ weeks
Weekly close below $51 (EMA20 area / last impulse support) shifts to deeper pullback risk
Buy-the-dip zones mapped to prior breakout retest ($57), EMA20 support (~$51), then EMA50/SMA50/SMA100 confluence ($46–$43) where trend typically refreshes if intact.
Trim into upside extensions above the $60 breakout as RSI/price stretch increases; higher bands represent progressively larger Fibonacci/psychological extension zones where multi-year forward returns typically compress.
As of March 26, 2026, BHE (Benchmark Electronics Inc.) is in a uptrend state on the weekly chart with 78% confidence. Strong weekly impulse to fresh highs near $60 after a breakout from the $42–$45 base; price extended above rising EMA50/EMA100 with RSI ~$69.
On the weekly timeframe, BHE has key support at $51.0 and key resistance at $60.0. The most likely scenario (bullish) targets $63.0 and $68.0, with a revert level at $57.0.
BHE (Benchmark Electronics Inc.) is currently classified as uptrend on the weekly chart, with 78% confidence. Confirmation requires: Weekly close holding above $57 (prior breakout zone) for 2+ weeks This would be invalidated by: Weekly close below $51 (EMA20 area / last impulse support) shifts to deeper pullback risk
The most likely scenario (bullish) targets $63.0 and $68.0, with a revert level at $57.0. The alternative scenario (bearish) targets $51.0 and $45.0.
Multi-layer AI agents analyse 200+ stocks across daily, weekly, and monthly timeframes — producing market state classifications, price scenarios with targets, and position entry/exit levels. Updated every trading day after market close. No paywall. No sign-up required.
Built by Foliotrail.
All content on this website — including charts, analysis, price targets, support/resistance levels, and position zones — is generated entirely by AI and provided for educational and informational purposes only.
This is not financial advice. NEXUSNOIR VENTURES SL (the operator of this website) is not a registered investment adviser or broker-dealer. You should not make investment decisions based solely on this information. Always do your own research and consult a qualified financial advisor.
By continuing, you acknowledge that you have read and agree to our full disclaimer & terms of use and privacy policy.