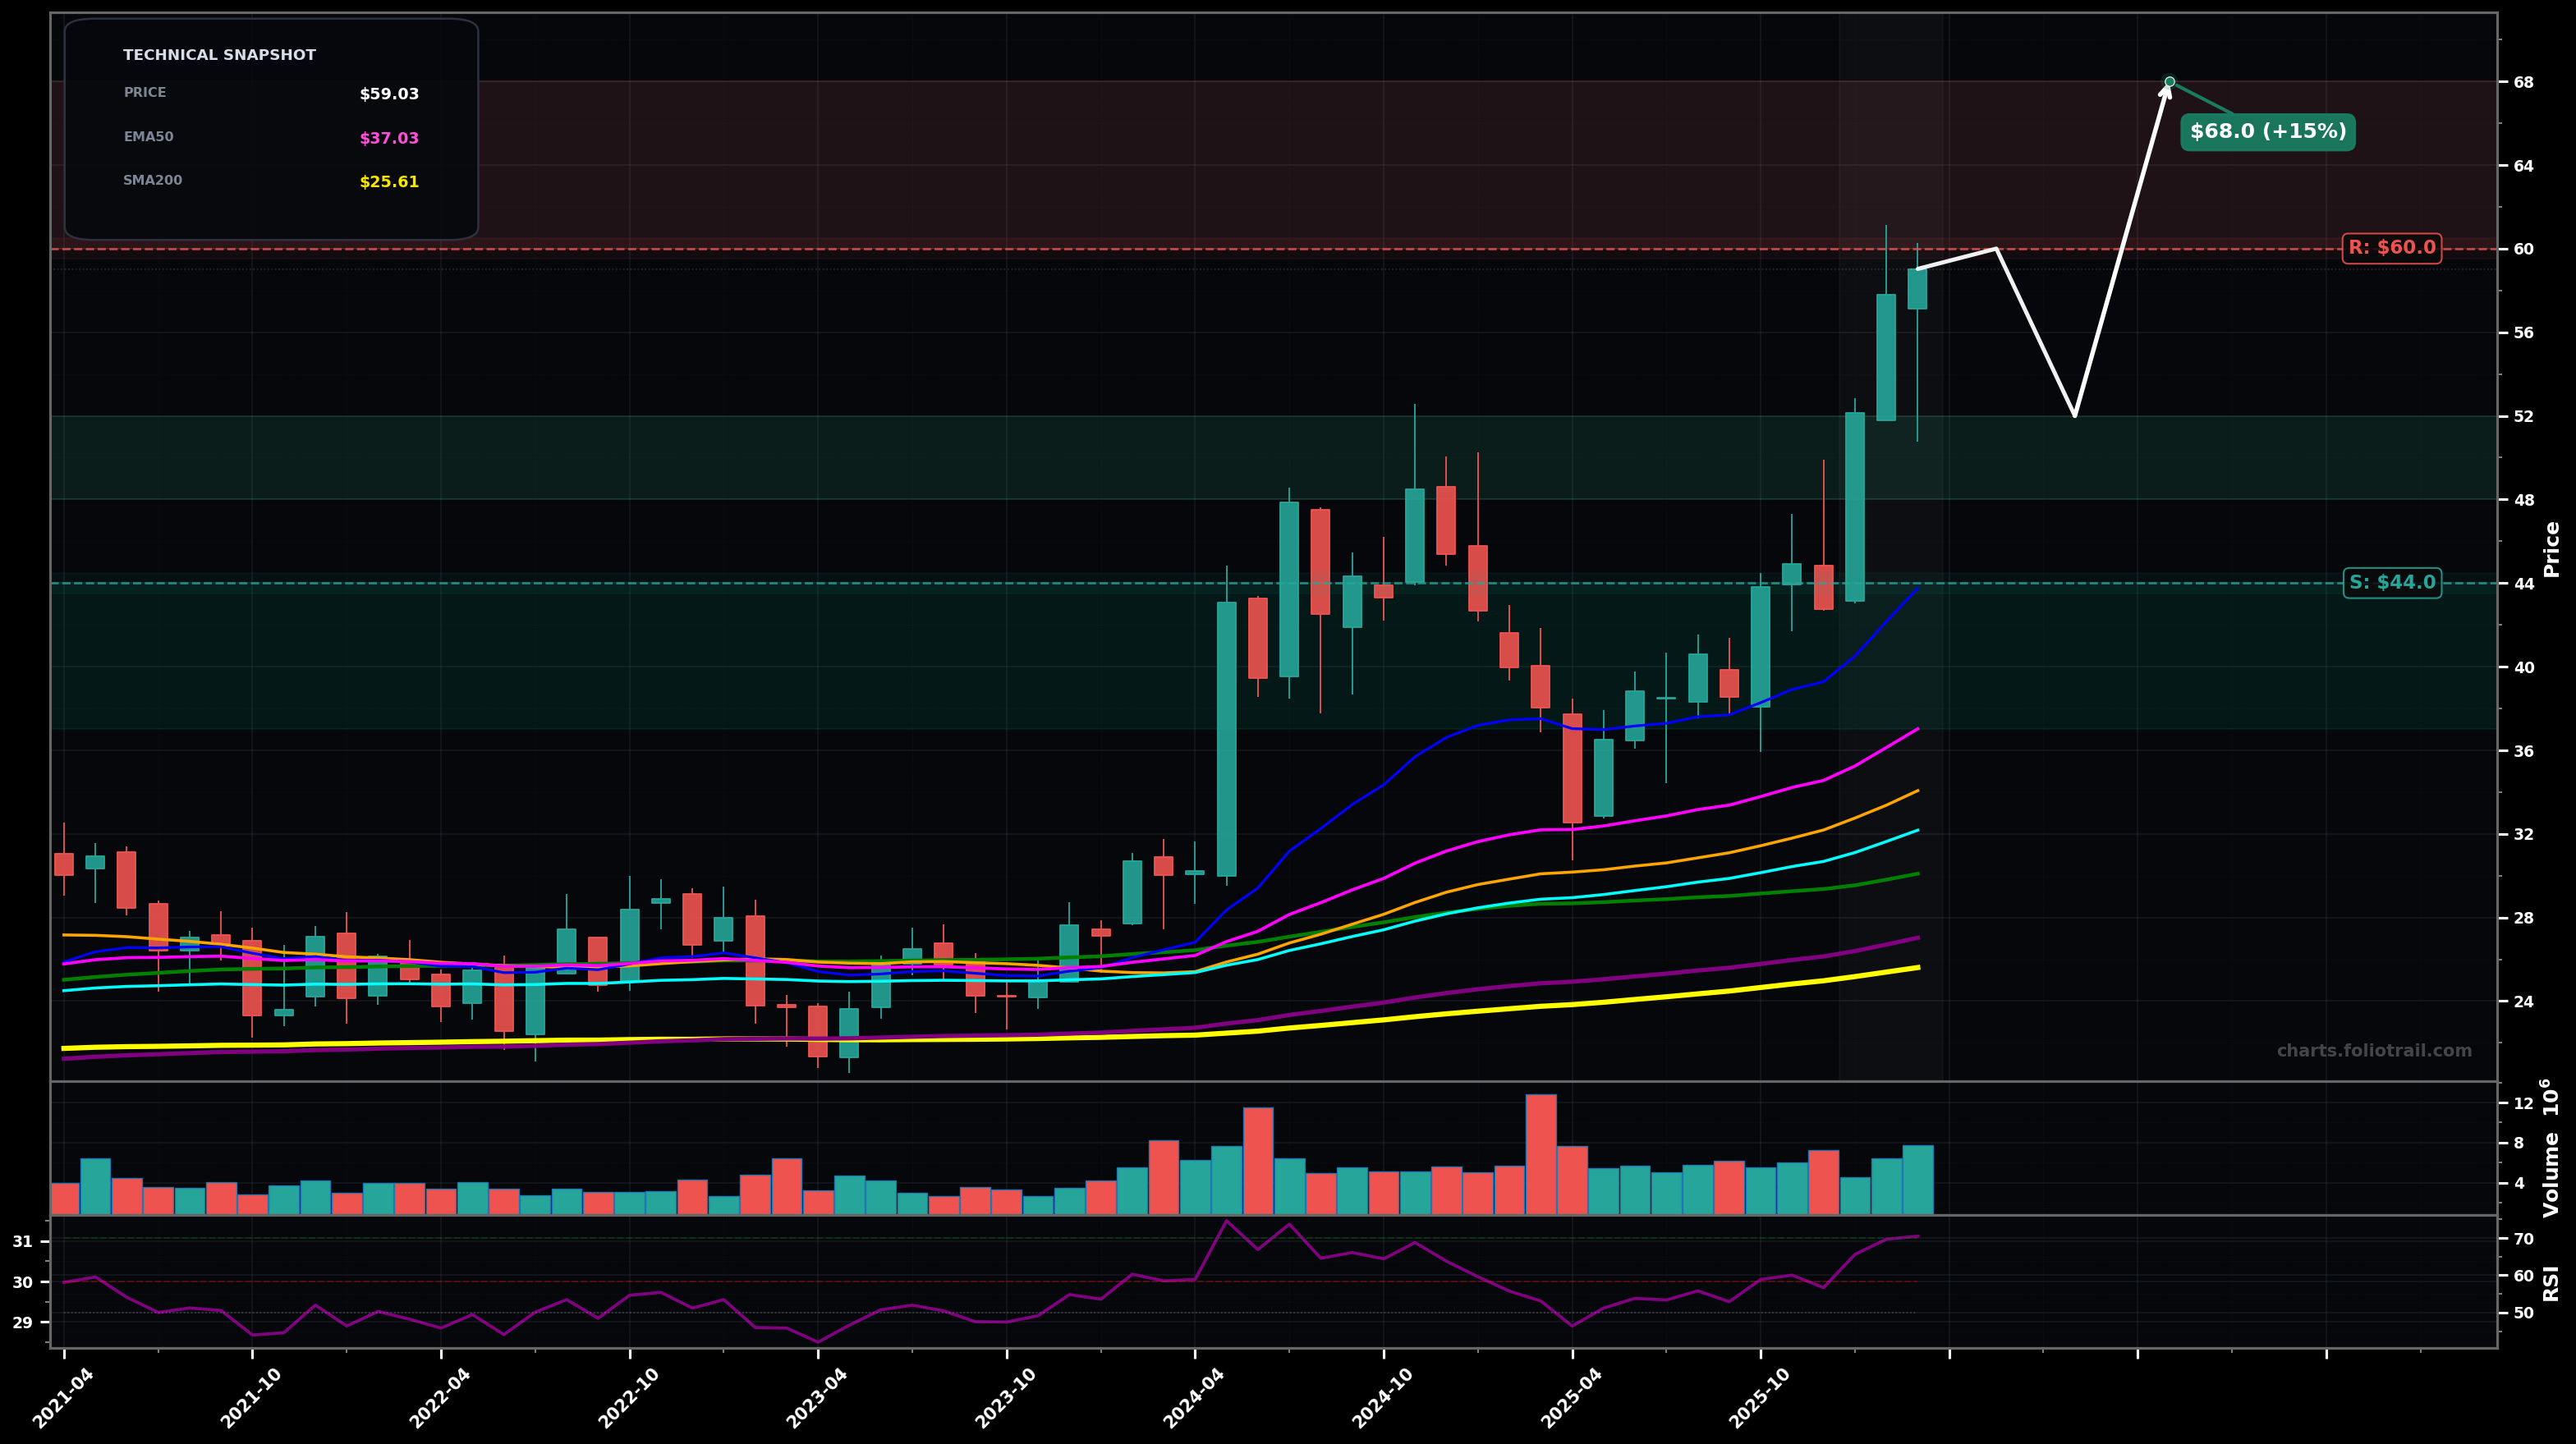
As of March 26, 2026, BHE (Benchmark Electronics Inc.) is in a parabolic state on the monthly chart, with a confidence level of 72%. Key support is at $44.0 and key resistance at $60.0. Strong monthly breakout to new highs near $59 with expanding candles; price stretched well above rising EMAs/SMA stack; RSI ~70 (overbought/strong momentum).
Bullish continuation: price consolidates briefly near the breakout then pushes higher (Elliott: likely Wave 5 extension after a Wave 4 sideways pause).
Mean-reversion pullback: parabolic move cools off and price retraces toward the last breakout shelf and fast MAs before attempting a new leg up (Elliott: Wave 4 deeper/complex correction).
2+ monthly closes above $60 would confirm continued parabolic extension.
Monthly close below $44 would invalidate parabolic strength and imply a deeper mean-reversion phase.
Buy-the-dip framework: $48–$52 is first pullback zone (recent breakout area), $44–$48 is prior swing support, $37–$44 aligns with EMA50/pink to reset an extended move.
Trims scale into strength: $60–$68 is first extension above the breakout, $68–$78 is a higher fib-extension/overextension zone, $78–$92 assumes a full blow-off where mean reversion risk dominates.
As of March 26, 2026, BHE (Benchmark Electronics Inc.) is in a parabolic state on the monthly chart with 72% confidence. Strong monthly breakout to new highs near $59 with expanding candles; price stretched well above rising EMAs/SMA stack; RSI ~70 (overbought/strong momentum).
On the monthly timeframe, BHE has key support at $44.0 and key resistance at $60.0. The most likely scenario (bullish) targets $60.0 and $68.0, with a revert level at $52.0.
BHE (Benchmark Electronics Inc.) is currently classified as parabolic on the monthly chart, with 72% confidence. Confirmation requires: 2+ monthly closes above $60 would confirm continued parabolic extension. This would be invalidated by: Monthly close below $44 would invalidate parabolic strength and imply a deeper mean-reversion phase.
The most likely scenario (bullish) targets $60.0 and $68.0, with a revert level at $52.0. The alternative scenario (bearish) targets $52.0 and $44.0.
Multi-layer AI agents analyse 200+ stocks across daily, weekly, and monthly timeframes — producing market state classifications, price scenarios with targets, and position entry/exit levels. Updated every trading day after market close. No paywall. No sign-up required.
Built by Foliotrail.
All content on this website — including charts, analysis, price targets, support/resistance levels, and position zones — is generated entirely by AI and provided for educational and informational purposes only.
This is not financial advice. NEXUSNOIR VENTURES SL (the operator of this website) is not a registered investment adviser or broker-dealer. You should not make investment decisions based solely on this information. Always do your own research and consult a qualified financial advisor.
By continuing, you acknowledge that you have read and agree to our full disclaimer & terms of use and privacy policy.